Immigrants from Barbados vs Navajo Female Poverty Among 25-34 Year Olds
COMPARE
Immigrants from Barbados
Navajo
Female Poverty Among 25-34 Year Olds
Female Poverty Among 25-34 Year Olds Comparison
Immigrants from Barbados
Navajo
14.5%
FEMALE POVERTY AMONG 25-34 YEAR OLDS
3.4/ 100
METRIC RATING
225th/ 347
METRIC RANK
23.3%
FEMALE POVERTY AMONG 25-34 YEAR OLDS
0.0/ 100
METRIC RATING
341st/ 347
METRIC RANK
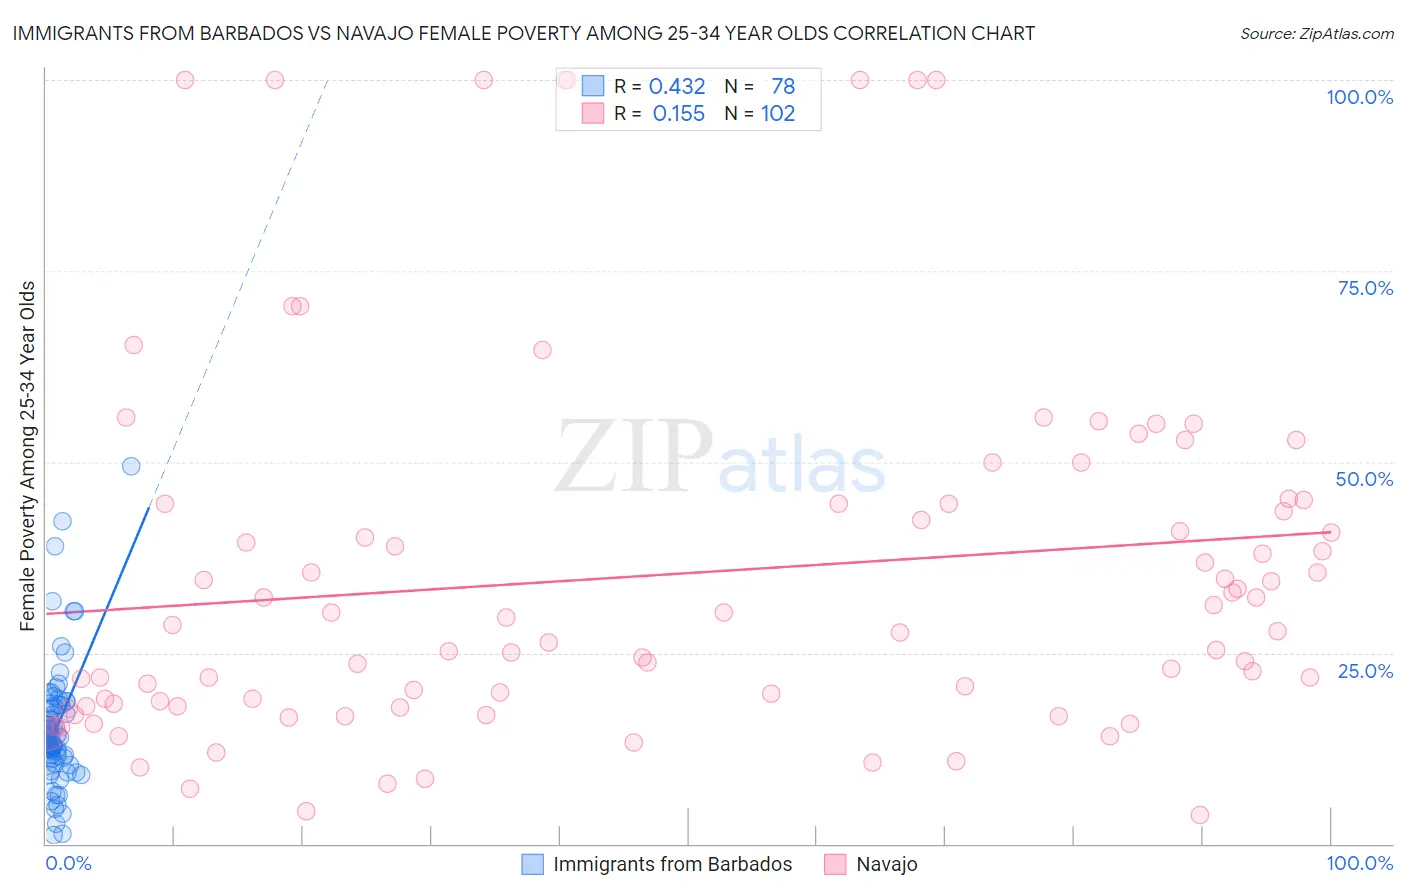
Immigrants from Barbados vs Navajo Female Poverty Among 25-34 Year Olds Correlation Chart
The statistical analysis conducted on geographies consisting of 112,289,086 people shows a moderate positive correlation between the proportion of Immigrants from Barbados and poverty level among females between the ages 25 and 34 in the United States with a correlation coefficient (R) of 0.432 and weighted average of 14.5%. Similarly, the statistical analysis conducted on geographies consisting of 223,320,871 people shows a poor positive correlation between the proportion of Navajo and poverty level among females between the ages 25 and 34 in the United States with a correlation coefficient (R) of 0.155 and weighted average of 23.3%, a difference of 61.3%.
Female Poverty Among 25-34 Year Olds Correlation Summary
| Measurement | Immigrants from Barbados | Navajo |
| Minimum | 1.1% | 3.7% |
| Maximum | 49.4% | 100.0% |
| Range | 48.3% | 96.3% |
| Mean | 15.1% | 35.2% |
| Median | 14.0% | 28.2% |
| Interquartile 25% (IQ1) | 11.1% | 18.1% |
| Interquartile 75% (IQ3) | 18.2% | 44.4% |
| Interquartile Range (IQR) | 7.1% | 26.4% |
| Standard Deviation (Sample) | 8.3% | 24.2% |
| Standard Deviation (Population) | 8.3% | 24.1% |
Similar Demographics by Female Poverty Among 25-34 Year Olds
Demographics Similar to Immigrants from Barbados by Female Poverty Among 25-34 Year Olds
In terms of female poverty among 25-34 year olds, the demographic groups most similar to Immigrants from Barbados are Nicaraguan (14.5%, a difference of 0.080%), Immigrants from Sudan (14.4%, a difference of 0.32%), Celtic (14.5%, a difference of 0.38%), Nigerian (14.4%, a difference of 0.39%), and Immigrants from Portugal (14.4%, a difference of 0.46%).
| Demographics | Rating | Rank | Female Poverty Among 25-34 Year Olds |
| Immigrants | Thailand | 5.2 /100 | #218 | Tragic 14.3% |
| Ecuadorians | 5.2 /100 | #219 | Tragic 14.3% |
| Ghanaians | 4.8 /100 | #220 | Tragic 14.4% |
| Sudanese | 4.4 /100 | #221 | Tragic 14.4% |
| Immigrants | Portugal | 4.3 /100 | #222 | Tragic 14.4% |
| Nigerians | 4.2 /100 | #223 | Tragic 14.4% |
| Immigrants | Sudan | 4.0 /100 | #224 | Tragic 14.4% |
| Immigrants | Barbados | 3.4 /100 | #225 | Tragic 14.5% |
| Nicaraguans | 3.3 /100 | #226 | Tragic 14.5% |
| Celtics | 2.8 /100 | #227 | Tragic 14.5% |
| Vietnamese | 2.6 /100 | #228 | Tragic 14.6% |
| Spanish | 2.5 /100 | #229 | Tragic 14.6% |
| Spaniards | 2.3 /100 | #230 | Tragic 14.6% |
| Delaware | 2.3 /100 | #231 | Tragic 14.6% |
| Immigrants | Ecuador | 1.9 /100 | #232 | Tragic 14.6% |
Demographics Similar to Navajo by Female Poverty Among 25-34 Year Olds
In terms of female poverty among 25-34 year olds, the demographic groups most similar to Navajo are Hopi (23.7%, a difference of 1.4%), Sioux (23.0%, a difference of 1.7%), Yuman (22.9%, a difference of 1.9%), Houma (22.7%, a difference of 2.7%), and Crow (22.7%, a difference of 2.9%).
| Demographics | Rating | Rank | Female Poverty Among 25-34 Year Olds |
| Cajuns | 0.0 /100 | #333 | Tragic 19.9% |
| Apache | 0.0 /100 | #334 | Tragic 20.1% |
| Natives/Alaskans | 0.0 /100 | #335 | Tragic 20.3% |
| Pueblo | 0.0 /100 | #336 | Tragic 22.2% |
| Crow | 0.0 /100 | #337 | Tragic 22.7% |
| Houma | 0.0 /100 | #338 | Tragic 22.7% |
| Yuman | 0.0 /100 | #339 | Tragic 22.9% |
| Sioux | 0.0 /100 | #340 | Tragic 23.0% |
| Navajo | 0.0 /100 | #341 | Tragic 23.3% |
| Hopi | 0.0 /100 | #342 | Tragic 23.7% |
| Yup'ik | 0.0 /100 | #343 | Tragic 24.3% |
| Tohono O'odham | 0.0 /100 | #344 | Tragic 24.7% |
| Pima | 0.0 /100 | #345 | Tragic 25.3% |
| Lumbee | 0.0 /100 | #346 | Tragic 26.3% |
| Puerto Ricans | 0.0 /100 | #347 | Tragic 26.3% |