Immigrants from Bahamas vs Immigrants from Belgium Female Poverty Among 18-24 Year Olds
COMPARE
Immigrants from Bahamas
Immigrants from Belgium
Female Poverty Among 18-24 Year Olds
Female Poverty Among 18-24 Year Olds Comparison
Immigrants from Bahamas
Immigrants from Belgium
21.4%
FEMALE POVERTY AMONG 18-24 YEAR OLDS
0.5/ 100
METRIC RATING
261st/ 347
METRIC RANK
19.8%
FEMALE POVERTY AMONG 18-24 YEAR OLDS
76.4/ 100
METRIC RATING
156th/ 347
METRIC RANK
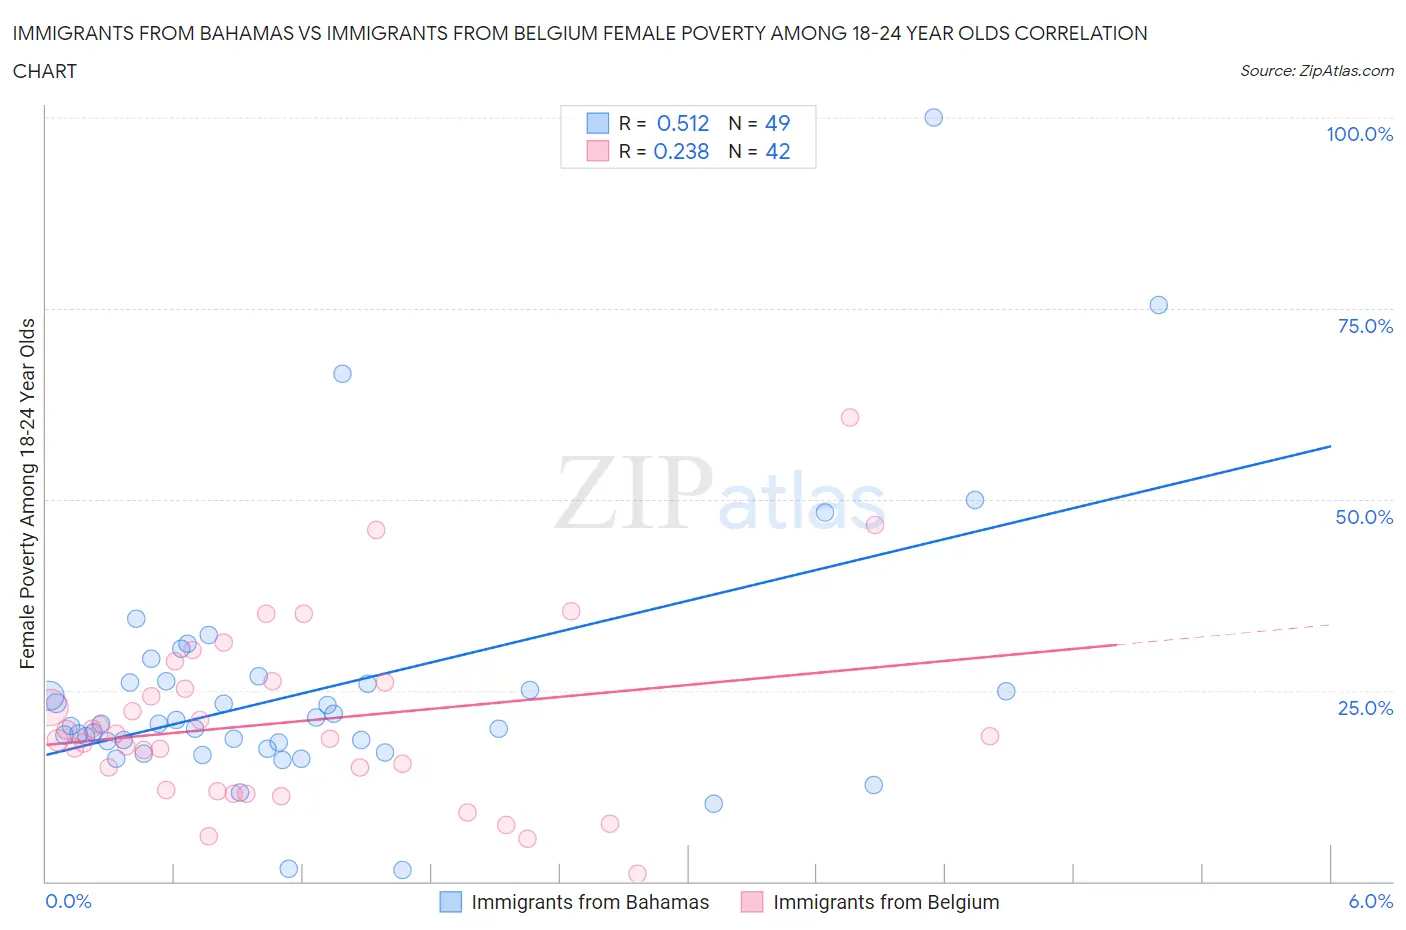
Immigrants from Bahamas vs Immigrants from Belgium Female Poverty Among 18-24 Year Olds Correlation Chart
The statistical analysis conducted on geographies consisting of 104,259,619 people shows a substantial positive correlation between the proportion of Immigrants from Bahamas and poverty level among females between the ages 18 and 24 in the United States with a correlation coefficient (R) of 0.512 and weighted average of 21.4%. Similarly, the statistical analysis conducted on geographies consisting of 144,999,845 people shows a weak positive correlation between the proportion of Immigrants from Belgium and poverty level among females between the ages 18 and 24 in the United States with a correlation coefficient (R) of 0.238 and weighted average of 19.8%, a difference of 8.0%.
Female Poverty Among 18-24 Year Olds Correlation Summary
| Measurement | Immigrants from Bahamas | Immigrants from Belgium |
| Minimum | 1.5% | 0.99% |
| Maximum | 100.0% | 60.8% |
| Range | 98.5% | 59.8% |
| Mean | 25.2% | 20.9% |
| Median | 20.6% | 18.8% |
| Interquartile 25% (IQ1) | 17.7% | 11.9% |
| Interquartile 75% (IQ3) | 26.0% | 26.0% |
| Interquartile Range (IQR) | 8.3% | 14.1% |
| Standard Deviation (Sample) | 17.0% | 11.9% |
| Standard Deviation (Population) | 16.9% | 11.8% |
Similar Demographics by Female Poverty Among 18-24 Year Olds
Demographics Similar to Immigrants from Bahamas by Female Poverty Among 18-24 Year Olds
In terms of female poverty among 18-24 year olds, the demographic groups most similar to Immigrants from Bahamas are Immigrants from Norway (21.4%, a difference of 0.070%), Immigrants from France (21.4%, a difference of 0.12%), Vietnamese (21.4%, a difference of 0.14%), Immigrants from Eastern Africa (21.4%, a difference of 0.20%), and Icelander (21.5%, a difference of 0.55%).
| Demographics | Rating | Rank | Female Poverty Among 18-24 Year Olds |
| British West Indians | 1.2 /100 | #254 | Tragic 21.2% |
| Immigrants | Grenada | 1.2 /100 | #255 | Tragic 21.2% |
| Tsimshian | 1.0 /100 | #256 | Tragic 21.2% |
| Taiwanese | 1.0 /100 | #257 | Tragic 21.2% |
| Vietnamese | 0.6 /100 | #258 | Tragic 21.4% |
| Immigrants | France | 0.6 /100 | #259 | Tragic 21.4% |
| Immigrants | Norway | 0.6 /100 | #260 | Tragic 21.4% |
| Immigrants | Bahamas | 0.5 /100 | #261 | Tragic 21.4% |
| Immigrants | Eastern Africa | 0.4 /100 | #262 | Tragic 21.4% |
| Icelanders | 0.3 /100 | #263 | Tragic 21.5% |
| Hondurans | 0.3 /100 | #264 | Tragic 21.5% |
| Immigrants | Nonimmigrants | 0.3 /100 | #265 | Tragic 21.5% |
| Alaska Natives | 0.3 /100 | #266 | Tragic 21.5% |
| Americans | 0.3 /100 | #267 | Tragic 21.6% |
| Immigrants | Burma/Myanmar | 0.2 /100 | #268 | Tragic 21.6% |
Demographics Similar to Immigrants from Belgium by Female Poverty Among 18-24 Year Olds
In terms of female poverty among 18-24 year olds, the demographic groups most similar to Immigrants from Belgium are Hungarian (19.8%, a difference of 0.010%), Immigrants from Zimbabwe (19.8%, a difference of 0.020%), Danish (19.8%, a difference of 0.060%), Immigrants from Lebanon (19.8%, a difference of 0.080%), and Immigrants from Japan (19.8%, a difference of 0.12%).
| Demographics | Rating | Rank | Female Poverty Among 18-24 Year Olds |
| Immigrants | Oceania | 81.2 /100 | #149 | Excellent 19.7% |
| Syrians | 80.2 /100 | #150 | Excellent 19.8% |
| Immigrants | Eastern Asia | 79.7 /100 | #151 | Good 19.8% |
| Yugoslavians | 79.0 /100 | #152 | Good 19.8% |
| Immigrants | Japan | 78.1 /100 | #153 | Good 19.8% |
| Immigrants | Zimbabwe | 76.7 /100 | #154 | Good 19.8% |
| Hungarians | 76.6 /100 | #155 | Good 19.8% |
| Immigrants | Belgium | 76.4 /100 | #156 | Good 19.8% |
| Danes | 75.5 /100 | #157 | Good 19.8% |
| Immigrants | Lebanon | 75.3 /100 | #158 | Good 19.8% |
| Trinidadians and Tobagonians | 74.4 /100 | #159 | Good 19.8% |
| Pakistanis | 74.1 /100 | #160 | Good 19.8% |
| Immigrants | Belize | 74.1 /100 | #161 | Good 19.8% |
| French Canadians | 73.0 /100 | #162 | Good 19.9% |
| Malaysians | 72.7 /100 | #163 | Good 19.9% |