Immigrants from the Azores vs Celtic Child Poverty Under the Age of 16
COMPARE
Immigrants from the Azores
Celtic
Child Poverty Under the Age of 16
Child Poverty Under the Age of 16 Comparison
Immigrants from the Azores
Celtics
17.5%
CHILD POVERTY UNDER THE AGE OF 16
6.2/ 100
METRIC RATING
213th/ 347
METRIC RANK
16.4%
CHILD POVERTY UNDER THE AGE OF 16
38.2/ 100
METRIC RATING
183rd/ 347
METRIC RANK
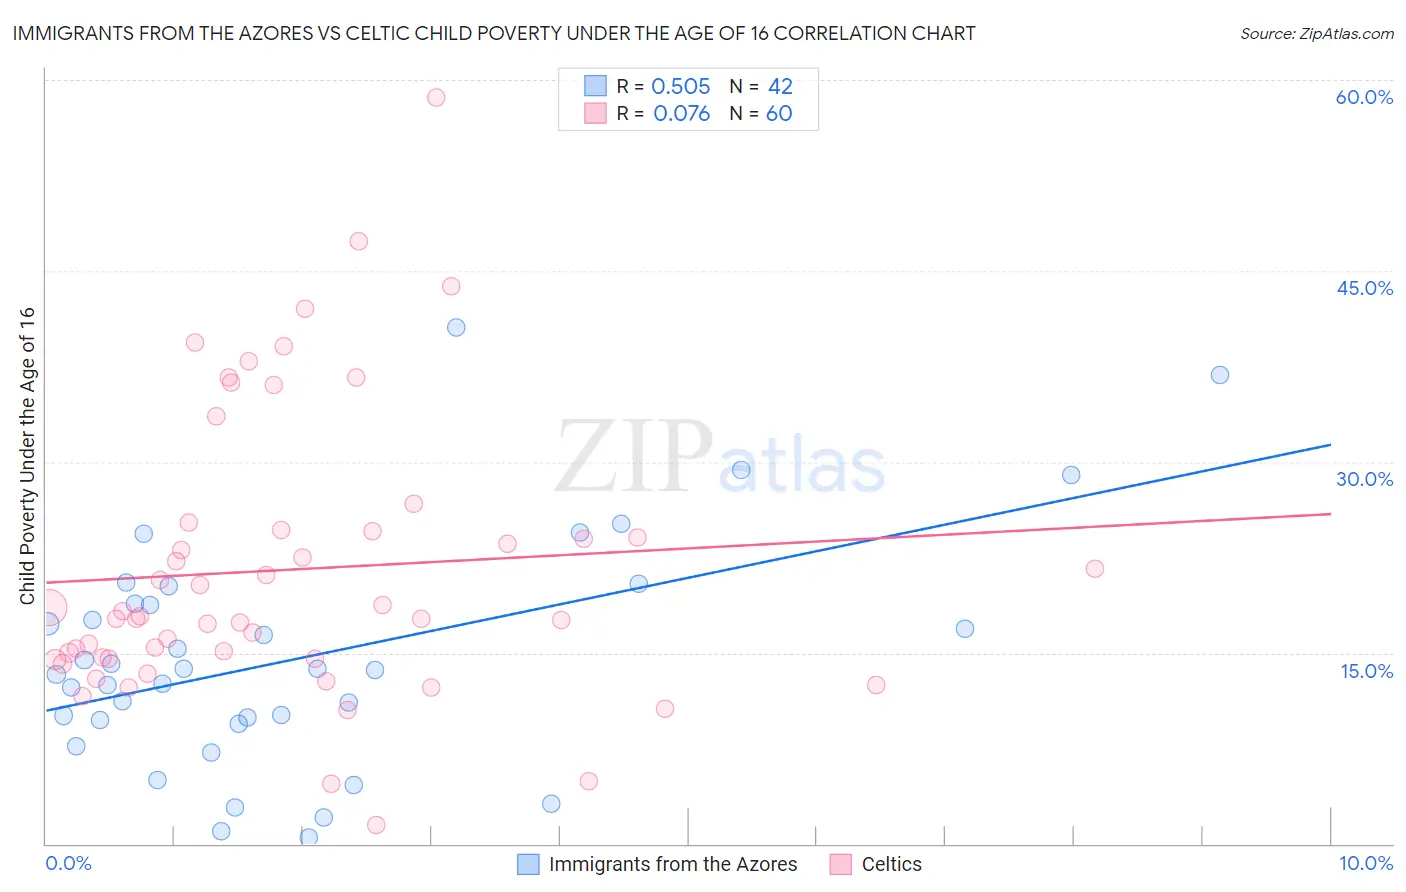
Immigrants from the Azores vs Celtic Child Poverty Under the Age of 16 Correlation Chart
The statistical analysis conducted on geographies consisting of 46,043,926 people shows a substantial positive correlation between the proportion of Immigrants from the Azores and poverty level among children under the age of 16 in the United States with a correlation coefficient (R) of 0.505 and weighted average of 17.5%. Similarly, the statistical analysis conducted on geographies consisting of 168,036,388 people shows a slight positive correlation between the proportion of Celtics and poverty level among children under the age of 16 in the United States with a correlation coefficient (R) of 0.076 and weighted average of 16.4%, a difference of 6.6%.
Child Poverty Under the Age of 16 Correlation Summary
| Measurement | Immigrants from the Azores | Celtic |
| Minimum | 0.48% | 1.4% |
| Maximum | 40.5% | 58.6% |
| Range | 40.0% | 57.2% |
| Mean | 14.7% | 21.5% |
| Median | 13.7% | 17.8% |
| Interquartile 25% (IQ1) | 9.7% | 14.5% |
| Interquartile 75% (IQ3) | 18.8% | 24.6% |
| Interquartile Range (IQR) | 9.1% | 10.1% |
| Standard Deviation (Sample) | 9.0% | 11.2% |
| Standard Deviation (Population) | 8.9% | 11.1% |
Similar Demographics by Child Poverty Under the Age of 16
Demographics Similar to Immigrants from the Azores by Child Poverty Under the Age of 16
In terms of child poverty under the age of 16, the demographic groups most similar to Immigrants from the Azores are Iraqi (17.5%, a difference of 0.12%), Malaysian (17.5%, a difference of 0.14%), Immigrants (17.5%, a difference of 0.17%), Immigrants from Thailand (17.5%, a difference of 0.19%), and Sierra Leonean (17.6%, a difference of 0.25%).
| Demographics | Rating | Rank | Child Poverty Under the Age of 16 |
| Alaska Natives | 11.8 /100 | #206 | Poor 17.2% |
| German Russians | 8.6 /100 | #207 | Tragic 17.4% |
| Pennsylvania Germans | 7.5 /100 | #208 | Tragic 17.4% |
| Panamanians | 6.9 /100 | #209 | Tragic 17.5% |
| Alaskan Athabascans | 6.9 /100 | #210 | Tragic 17.5% |
| Immigrants | Thailand | 6.6 /100 | #211 | Tragic 17.5% |
| Immigrants | Immigrants | 6.5 /100 | #212 | Tragic 17.5% |
| Immigrants | Azores | 6.2 /100 | #213 | Tragic 17.5% |
| Iraqis | 5.9 /100 | #214 | Tragic 17.5% |
| Malaysians | 5.9 /100 | #215 | Tragic 17.5% |
| Sierra Leoneans | 5.7 /100 | #216 | Tragic 17.6% |
| Immigrants | Eastern Africa | 5.3 /100 | #217 | Tragic 17.6% |
| Moroccans | 5.3 /100 | #218 | Tragic 17.6% |
| Japanese | 4.7 /100 | #219 | Tragic 17.7% |
| Immigrants | Panama | 4.1 /100 | #220 | Tragic 17.7% |
Demographics Similar to Celtics by Child Poverty Under the Age of 16
In terms of child poverty under the age of 16, the demographic groups most similar to Celtics are Hawaiian (16.4%, a difference of 0.010%), Immigrants from Western Asia (16.4%, a difference of 0.020%), Immigrants from Bosnia and Herzegovina (16.5%, a difference of 0.10%), Immigrants from South America (16.4%, a difference of 0.33%), and South American Indian (16.4%, a difference of 0.46%).
| Demographics | Rating | Rank | Child Poverty Under the Age of 16 |
| Lebanese | 45.9 /100 | #176 | Average 16.3% |
| Ethiopians | 43.4 /100 | #177 | Average 16.3% |
| Immigrants | Ethiopia | 42.3 /100 | #178 | Average 16.4% |
| Immigrants | Syria | 42.3 /100 | #179 | Average 16.4% |
| South American Indians | 41.8 /100 | #180 | Average 16.4% |
| Immigrants | South America | 40.8 /100 | #181 | Average 16.4% |
| Hawaiians | 38.2 /100 | #182 | Fair 16.4% |
| Celtics | 38.2 /100 | #183 | Fair 16.4% |
| Immigrants | Western Asia | 38.0 /100 | #184 | Fair 16.4% |
| Immigrants | Bosnia and Herzegovina | 37.4 /100 | #185 | Fair 16.5% |
| Kenyans | 34.1 /100 | #186 | Fair 16.5% |
| Arabs | 31.4 /100 | #187 | Fair 16.6% |
| Immigrants | Morocco | 31.2 /100 | #188 | Fair 16.6% |
| Immigrants | Portugal | 30.0 /100 | #189 | Fair 16.6% |
| Immigrants | Costa Rica | 29.6 /100 | #190 | Fair 16.6% |