Immigrants from Asia vs Bangladeshi Child Poverty Under the Age of 5
COMPARE
Immigrants from Asia
Bangladeshi
Child Poverty Under the Age of 5
Child Poverty Under the Age of 5 Comparison
Immigrants from Asia
Bangladeshis
14.4%
CHILD POVERTY UNDER THE AGE OF 5
99.8/ 100
METRIC RATING
29th/ 347
METRIC RANK
20.6%
CHILD POVERTY UNDER THE AGE OF 5
0.1/ 100
METRIC RATING
275th/ 347
METRIC RANK
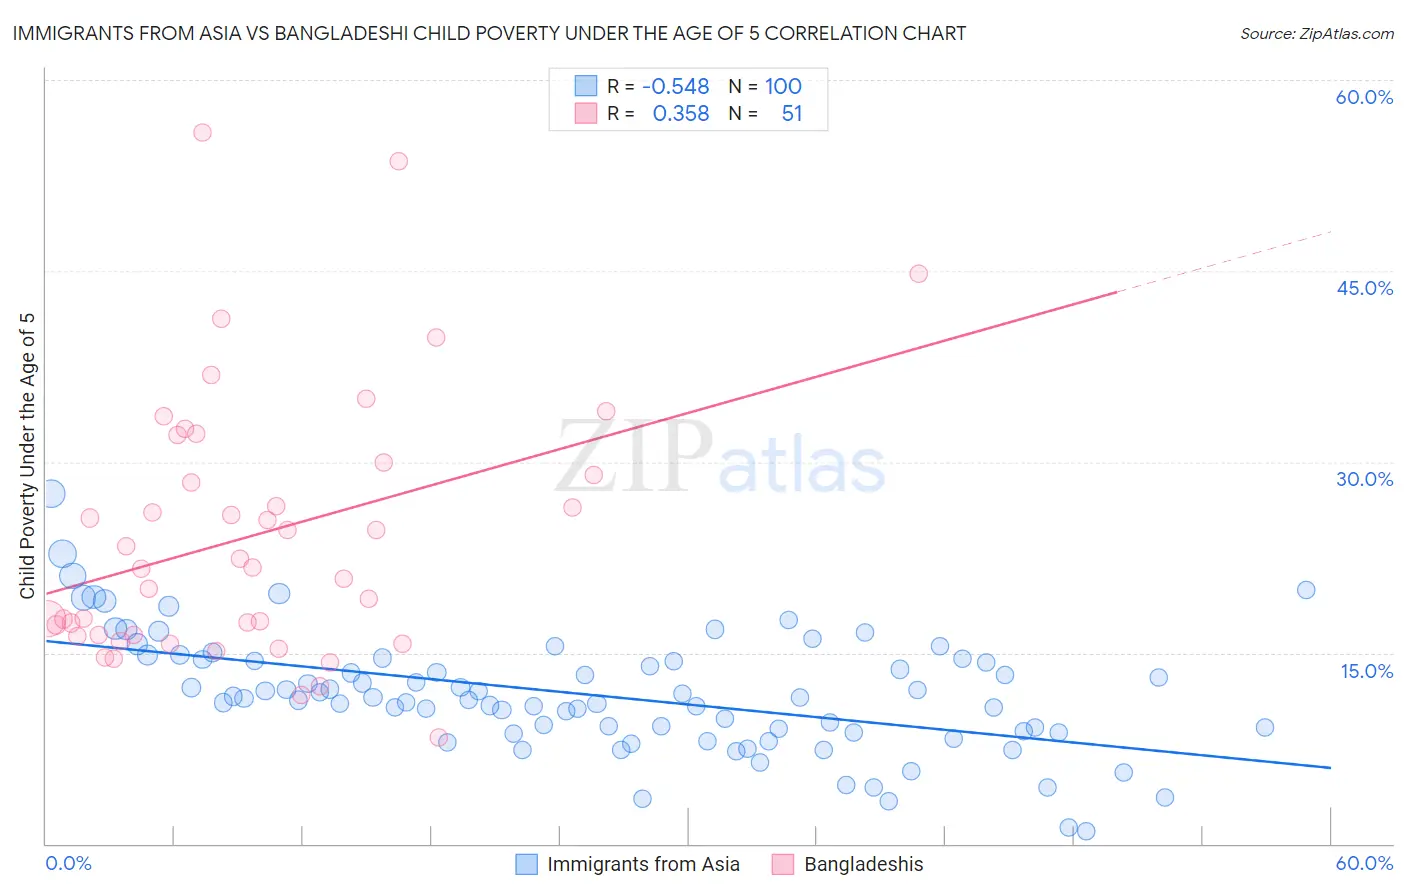
Immigrants from Asia vs Bangladeshi Child Poverty Under the Age of 5 Correlation Chart
The statistical analysis conducted on geographies consisting of 514,624,592 people shows a substantial negative correlation between the proportion of Immigrants from Asia and poverty level among children under the age of 5 in the United States with a correlation coefficient (R) of -0.548 and weighted average of 14.4%. Similarly, the statistical analysis conducted on geographies consisting of 139,356,548 people shows a mild positive correlation between the proportion of Bangladeshis and poverty level among children under the age of 5 in the United States with a correlation coefficient (R) of 0.358 and weighted average of 20.6%, a difference of 43.3%.
Child Poverty Under the Age of 5 Correlation Summary
| Measurement | Immigrants from Asia | Bangladeshi |
| Minimum | 1.0% | 8.3% |
| Maximum | 27.5% | 55.9% |
| Range | 26.4% | 47.5% |
| Mean | 11.7% | 24.3% |
| Median | 11.5% | 21.7% |
| Interquartile 25% (IQ1) | 8.8% | 16.4% |
| Interquartile 75% (IQ3) | 14.4% | 30.0% |
| Interquartile Range (IQR) | 5.6% | 13.6% |
| Standard Deviation (Sample) | 4.6% | 10.3% |
| Standard Deviation (Population) | 4.6% | 10.2% |
Similar Demographics by Child Poverty Under the Age of 5
Demographics Similar to Immigrants from Asia by Child Poverty Under the Age of 5
In terms of child poverty under the age of 5, the demographic groups most similar to Immigrants from Asia are Cambodian (14.4%, a difference of 0.050%), Korean (14.4%, a difference of 0.080%), Immigrants from Sri Lanka (14.4%, a difference of 0.36%), Immigrants from Indonesia (14.3%, a difference of 0.39%), and Taiwanese (14.5%, a difference of 0.66%).
| Demographics | Rating | Rank | Child Poverty Under the Age of 5 |
| Immigrants | Bolivia | 100.0 /100 | #22 | Exceptional 13.8% |
| Bulgarians | 99.9 /100 | #23 | Exceptional 13.9% |
| Asians | 99.9 /100 | #24 | Exceptional 14.0% |
| Cypriots | 99.9 /100 | #25 | Exceptional 14.0% |
| Immigrants | Lithuania | 99.9 /100 | #26 | Exceptional 14.1% |
| Tongans | 99.9 /100 | #27 | Exceptional 14.2% |
| Immigrants | Indonesia | 99.8 /100 | #28 | Exceptional 14.3% |
| Immigrants | Asia | 99.8 /100 | #29 | Exceptional 14.4% |
| Cambodians | 99.8 /100 | #30 | Exceptional 14.4% |
| Koreans | 99.8 /100 | #31 | Exceptional 14.4% |
| Immigrants | Sri Lanka | 99.8 /100 | #32 | Exceptional 14.4% |
| Taiwanese | 99.8 /100 | #33 | Exceptional 14.5% |
| Immigrants | Moldova | 99.8 /100 | #34 | Exceptional 14.5% |
| Latvians | 99.8 /100 | #35 | Exceptional 14.5% |
| Maltese | 99.8 /100 | #36 | Exceptional 14.5% |
Demographics Similar to Bangladeshis by Child Poverty Under the Age of 5
In terms of child poverty under the age of 5, the demographic groups most similar to Bangladeshis are Immigrants from Belize (20.6%, a difference of 0.050%), West Indian (20.6%, a difference of 0.090%), Central American (20.6%, a difference of 0.15%), Immigrants from West Indies (20.7%, a difference of 0.26%), and Immigrants from Grenada (20.7%, a difference of 0.28%).
| Demographics | Rating | Rank | Child Poverty Under the Age of 5 |
| Belizeans | 0.1 /100 | #268 | Tragic 20.3% |
| Immigrants | Burma/Myanmar | 0.1 /100 | #269 | Tragic 20.4% |
| Jamaicans | 0.1 /100 | #270 | Tragic 20.4% |
| Americans | 0.1 /100 | #271 | Tragic 20.5% |
| Immigrants | Jamaica | 0.1 /100 | #272 | Tragic 20.5% |
| Central Americans | 0.1 /100 | #273 | Tragic 20.6% |
| Immigrants | Belize | 0.1 /100 | #274 | Tragic 20.6% |
| Bangladeshis | 0.1 /100 | #275 | Tragic 20.6% |
| West Indians | 0.0 /100 | #276 | Tragic 20.6% |
| Immigrants | West Indies | 0.0 /100 | #277 | Tragic 20.7% |
| Immigrants | Grenada | 0.0 /100 | #278 | Tragic 20.7% |
| Sub-Saharan Africans | 0.0 /100 | #279 | Tragic 20.8% |
| French American Indians | 0.0 /100 | #280 | Tragic 20.8% |
| Senegalese | 0.0 /100 | #281 | Tragic 20.9% |
| Potawatomi | 0.0 /100 | #282 | Tragic 21.0% |