Icelander vs Immigrants from Yemen Seniors Poverty Over the Age of 65
COMPARE
Icelander
Immigrants from Yemen
Seniors Poverty Over the Age of 65
Seniors Poverty Over the Age of 65 Comparison
Icelanders
Immigrants from Yemen
10.3%
SENIORS POVERTY OVER THE AGE OF 65
94.4/ 100
METRIC RATING
103rd/ 347
METRIC RANK
15.9%
SENIORS POVERTY OVER THE AGE OF 65
0.0/ 100
METRIC RATING
333rd/ 347
METRIC RANK
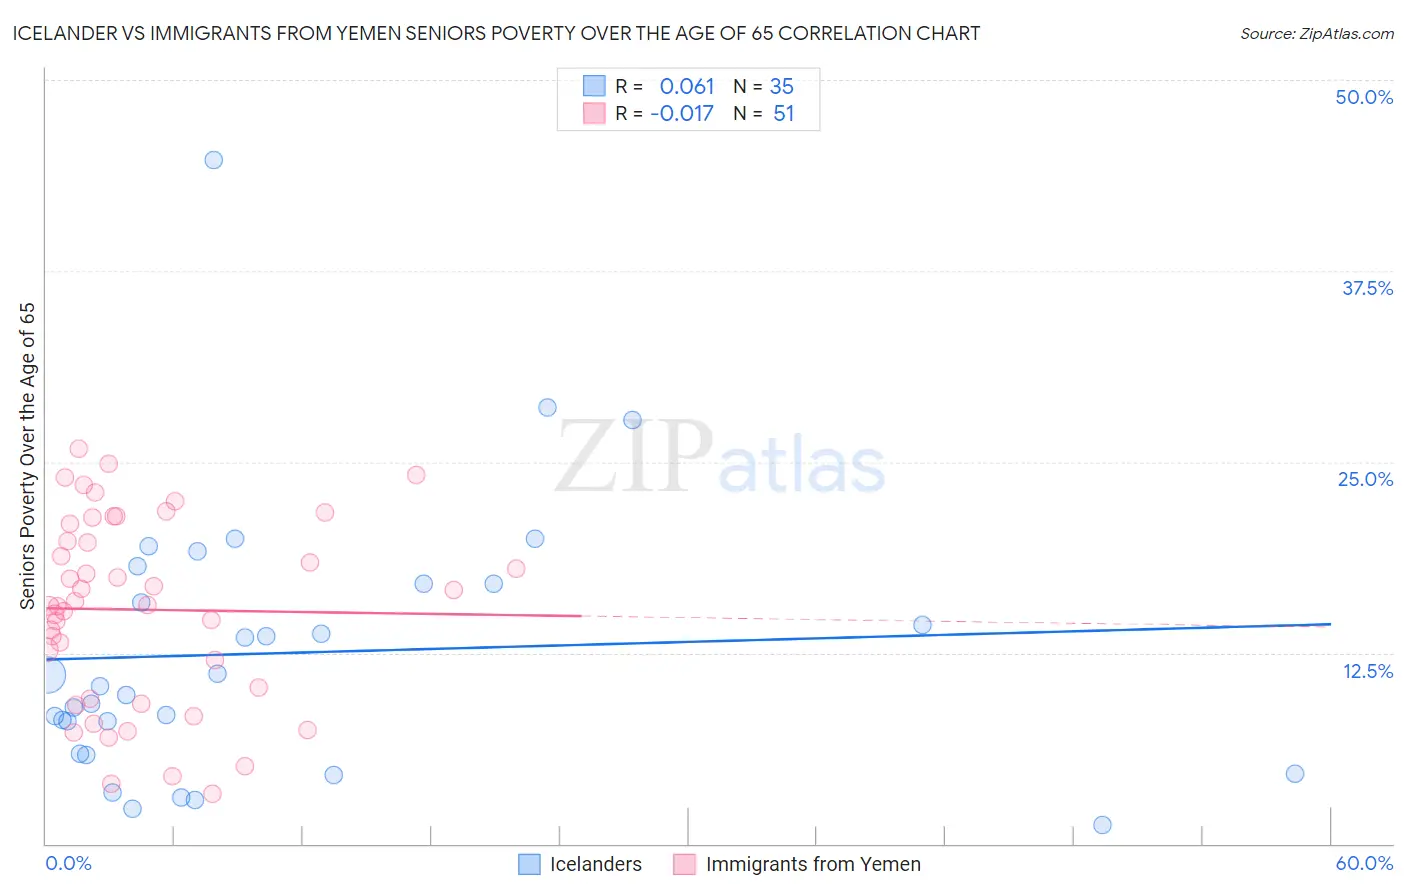
Icelander vs Immigrants from Yemen Seniors Poverty Over the Age of 65 Correlation Chart
The statistical analysis conducted on geographies consisting of 159,526,770 people shows a slight positive correlation between the proportion of Icelanders and poverty level among seniors over the age of 65 in the United States with a correlation coefficient (R) of 0.061 and weighted average of 10.3%. Similarly, the statistical analysis conducted on geographies consisting of 82,406,472 people shows no correlation between the proportion of Immigrants from Yemen and poverty level among seniors over the age of 65 in the United States with a correlation coefficient (R) of -0.017 and weighted average of 15.9%, a difference of 54.9%.
Seniors Poverty Over the Age of 65 Correlation Summary
| Measurement | Icelander | Immigrants from Yemen |
| Minimum | 1.2% | 3.3% |
| Maximum | 44.7% | 25.8% |
| Range | 43.5% | 22.6% |
| Mean | 12.5% | 15.3% |
| Median | 10.3% | 15.7% |
| Interquartile 25% (IQ1) | 5.9% | 9.5% |
| Interquartile 75% (IQ3) | 17.0% | 21.0% |
| Interquartile Range (IQR) | 11.1% | 11.5% |
| Standard Deviation (Sample) | 8.9% | 6.1% |
| Standard Deviation (Population) | 8.7% | 6.1% |
Similar Demographics by Seniors Poverty Over the Age of 65
Demographics Similar to Icelanders by Seniors Poverty Over the Age of 65
In terms of seniors poverty over the age of 65, the demographic groups most similar to Icelanders are South African (10.3%, a difference of 0.040%), Delaware (10.2%, a difference of 0.050%), Aleut (10.3%, a difference of 0.11%), Kenyan (10.3%, a difference of 0.13%), and Immigrants from Jordan (10.2%, a difference of 0.15%).
| Demographics | Rating | Rank | Seniors Poverty Over the Age of 65 |
| Basques | 95.9 /100 | #96 | Exceptional 10.2% |
| Immigrants | Pakistan | 95.7 /100 | #97 | Exceptional 10.2% |
| Immigrants | Kuwait | 95.5 /100 | #98 | Exceptional 10.2% |
| Cypriots | 95.5 /100 | #99 | Exceptional 10.2% |
| Marshallese | 95.3 /100 | #100 | Exceptional 10.2% |
| Immigrants | Jordan | 94.7 /100 | #101 | Exceptional 10.2% |
| Delaware | 94.5 /100 | #102 | Exceptional 10.2% |
| Icelanders | 94.4 /100 | #103 | Exceptional 10.3% |
| South Africans | 94.3 /100 | #104 | Exceptional 10.3% |
| Aleuts | 94.1 /100 | #105 | Exceptional 10.3% |
| Kenyans | 94.1 /100 | #106 | Exceptional 10.3% |
| Hawaiians | 93.9 /100 | #107 | Exceptional 10.3% |
| Immigrants | Croatia | 93.9 /100 | #108 | Exceptional 10.3% |
| Syrians | 93.8 /100 | #109 | Exceptional 10.3% |
| Immigrants | Zimbabwe | 93.5 /100 | #110 | Exceptional 10.3% |
Demographics Similar to Immigrants from Yemen by Seniors Poverty Over the Age of 65
In terms of seniors poverty over the age of 65, the demographic groups most similar to Immigrants from Yemen are Immigrants from Nicaragua (15.9%, a difference of 0.15%), Immigrants from Grenada (15.8%, a difference of 0.44%), Cuban (16.1%, a difference of 1.4%), British West Indian (15.6%, a difference of 1.8%), and Immigrants from Cabo Verde (16.2%, a difference of 2.0%).
| Demographics | Rating | Rank | Seniors Poverty Over the Age of 65 |
| Immigrants | Armenia | 0.0 /100 | #326 | Tragic 15.2% |
| Crow | 0.0 /100 | #327 | Tragic 15.2% |
| Sioux | 0.0 /100 | #328 | Tragic 15.3% |
| Immigrants | Dominica | 0.0 /100 | #329 | Tragic 15.5% |
| Immigrants | St. Vincent and the Grenadines | 0.0 /100 | #330 | Tragic 15.5% |
| British West Indians | 0.0 /100 | #331 | Tragic 15.6% |
| Immigrants | Grenada | 0.0 /100 | #332 | Tragic 15.8% |
| Immigrants | Yemen | 0.0 /100 | #333 | Tragic 15.9% |
| Immigrants | Nicaragua | 0.0 /100 | #334 | Tragic 15.9% |
| Cubans | 0.0 /100 | #335 | Tragic 16.1% |
| Immigrants | Cabo Verde | 0.0 /100 | #336 | Tragic 16.2% |
| Immigrants | Caribbean | 0.0 /100 | #337 | Tragic 16.5% |
| Pueblo | 0.0 /100 | #338 | Tragic 17.2% |
| Navajo | 0.0 /100 | #339 | Tragic 17.5% |
| Hopi | 0.0 /100 | #340 | Tragic 17.8% |