Icelander vs Immigrants from Belgium Seniors Poverty Over the Age of 65
COMPARE
Icelander
Immigrants from Belgium
Seniors Poverty Over the Age of 65
Seniors Poverty Over the Age of 65 Comparison
Icelanders
Immigrants from Belgium
10.3%
SENIORS POVERTY OVER THE AGE OF 65
94.4/ 100
METRIC RATING
103rd/ 347
METRIC RANK
10.3%
SENIORS POVERTY OVER THE AGE OF 65
93.4/ 100
METRIC RATING
111th/ 347
METRIC RANK
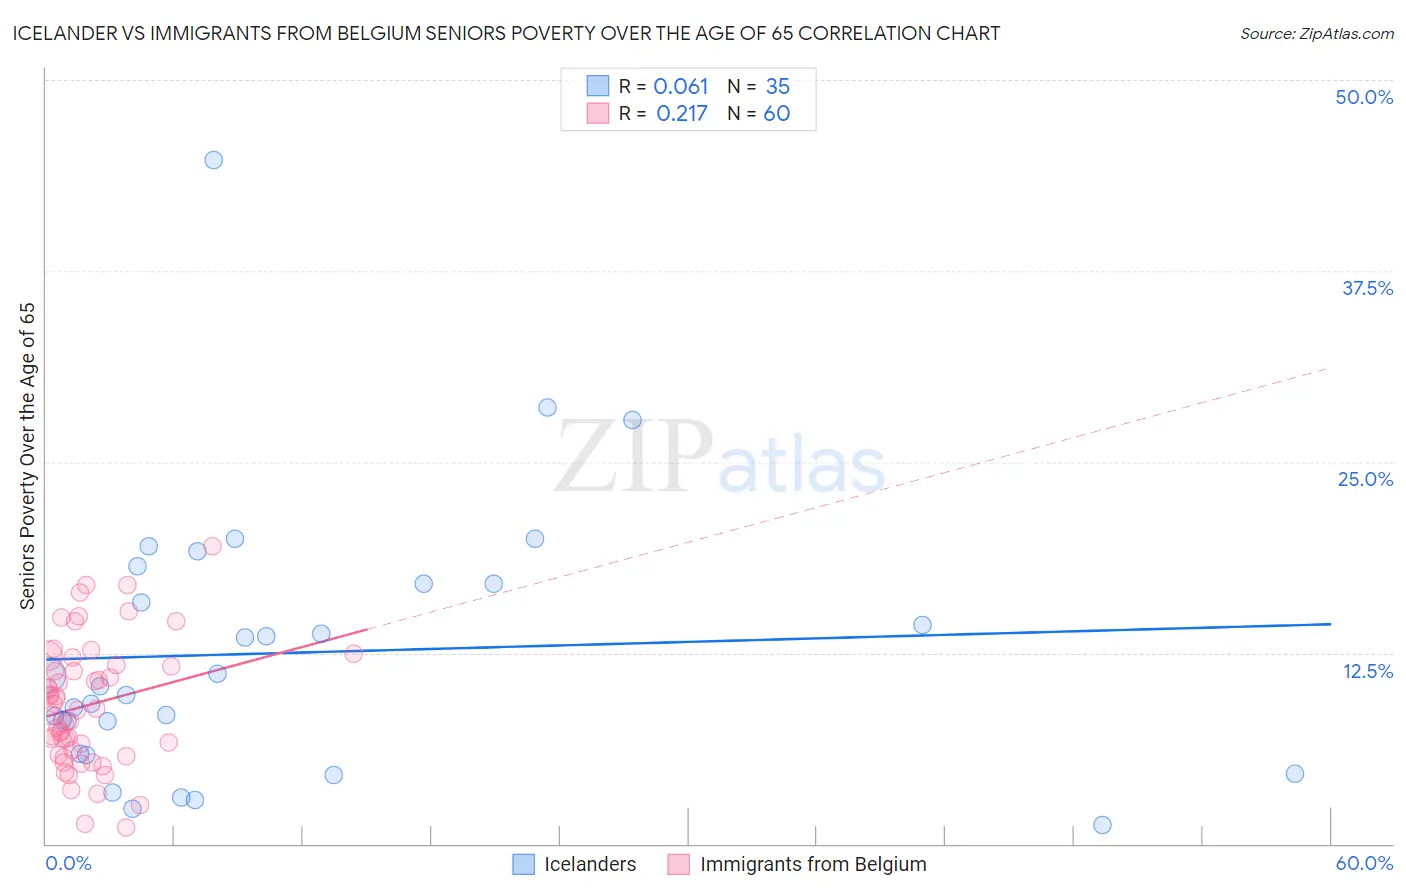
Icelander vs Immigrants from Belgium Seniors Poverty Over the Age of 65 Correlation Chart
The statistical analysis conducted on geographies consisting of 159,526,770 people shows a slight positive correlation between the proportion of Icelanders and poverty level among seniors over the age of 65 in the United States with a correlation coefficient (R) of 0.061 and weighted average of 10.3%. Similarly, the statistical analysis conducted on geographies consisting of 146,577,251 people shows a weak positive correlation between the proportion of Immigrants from Belgium and poverty level among seniors over the age of 65 in the United States with a correlation coefficient (R) of 0.217 and weighted average of 10.3%, a difference of 0.40%.
Seniors Poverty Over the Age of 65 Correlation Summary
| Measurement | Icelander | Immigrants from Belgium |
| Minimum | 1.2% | 1.1% |
| Maximum | 44.7% | 19.5% |
| Range | 43.5% | 18.4% |
| Mean | 12.5% | 9.1% |
| Median | 10.3% | 8.8% |
| Interquartile 25% (IQ1) | 5.9% | 6.0% |
| Interquartile 75% (IQ3) | 17.0% | 11.6% |
| Interquartile Range (IQR) | 11.1% | 5.7% |
| Standard Deviation (Sample) | 8.9% | 4.1% |
| Standard Deviation (Population) | 8.7% | 4.1% |
Demographics Similar to Icelanders and Immigrants from Belgium by Seniors Poverty Over the Age of 65
In terms of seniors poverty over the age of 65, the demographic groups most similar to Icelanders are South African (10.3%, a difference of 0.040%), Delaware (10.2%, a difference of 0.050%), Aleut (10.3%, a difference of 0.11%), Kenyan (10.3%, a difference of 0.13%), and Immigrants from Jordan (10.2%, a difference of 0.15%). Similarly, the demographic groups most similar to Immigrants from Belgium are Immigrants from Korea (10.3%, a difference of 0.020%), Immigrants from Zimbabwe (10.3%, a difference of 0.030%), Immigrants from Romania (10.3%, a difference of 0.060%), Syrian (10.3%, a difference of 0.17%), and Hawaiian (10.3%, a difference of 0.20%).
| Demographics | Rating | Rank | Seniors Poverty Over the Age of 65 |
| Immigrants | Pakistan | 95.7 /100 | #97 | Exceptional 10.2% |
| Immigrants | Kuwait | 95.5 /100 | #98 | Exceptional 10.2% |
| Cypriots | 95.5 /100 | #99 | Exceptional 10.2% |
| Marshallese | 95.3 /100 | #100 | Exceptional 10.2% |
| Immigrants | Jordan | 94.7 /100 | #101 | Exceptional 10.2% |
| Delaware | 94.5 /100 | #102 | Exceptional 10.2% |
| Icelanders | 94.4 /100 | #103 | Exceptional 10.3% |
| South Africans | 94.3 /100 | #104 | Exceptional 10.3% |
| Aleuts | 94.1 /100 | #105 | Exceptional 10.3% |
| Kenyans | 94.1 /100 | #106 | Exceptional 10.3% |
| Hawaiians | 93.9 /100 | #107 | Exceptional 10.3% |
| Immigrants | Croatia | 93.9 /100 | #108 | Exceptional 10.3% |
| Syrians | 93.8 /100 | #109 | Exceptional 10.3% |
| Immigrants | Zimbabwe | 93.5 /100 | #110 | Exceptional 10.3% |
| Immigrants | Belgium | 93.4 /100 | #111 | Exceptional 10.3% |
| Immigrants | Korea | 93.3 /100 | #112 | Exceptional 10.3% |
| Immigrants | Romania | 93.3 /100 | #113 | Exceptional 10.3% |
| Immigrants | Denmark | 92.7 /100 | #114 | Exceptional 10.3% |
| Immigrants | Italy | 92.6 /100 | #115 | Exceptional 10.3% |
| Pakistanis | 92.2 /100 | #116 | Exceptional 10.3% |
| Lebanese | 92.0 /100 | #117 | Exceptional 10.3% |