Hispanic or Latino vs Immigrants from Pakistan Child Poverty Among Boys Under 16
COMPARE
Hispanic or Latino
Immigrants from Pakistan
Child Poverty Among Boys Under 16
Child Poverty Among Boys Under 16 Comparison
Hispanics or Latinos
Immigrants from Pakistan
20.9%
CHILD POVERTY AMONG BOYS UNDER 16
0.0/ 100
METRIC RATING
297th/ 347
METRIC RANK
14.3%
CHILD POVERTY AMONG BOYS UNDER 16
99.0/ 100
METRIC RATING
55th/ 347
METRIC RANK
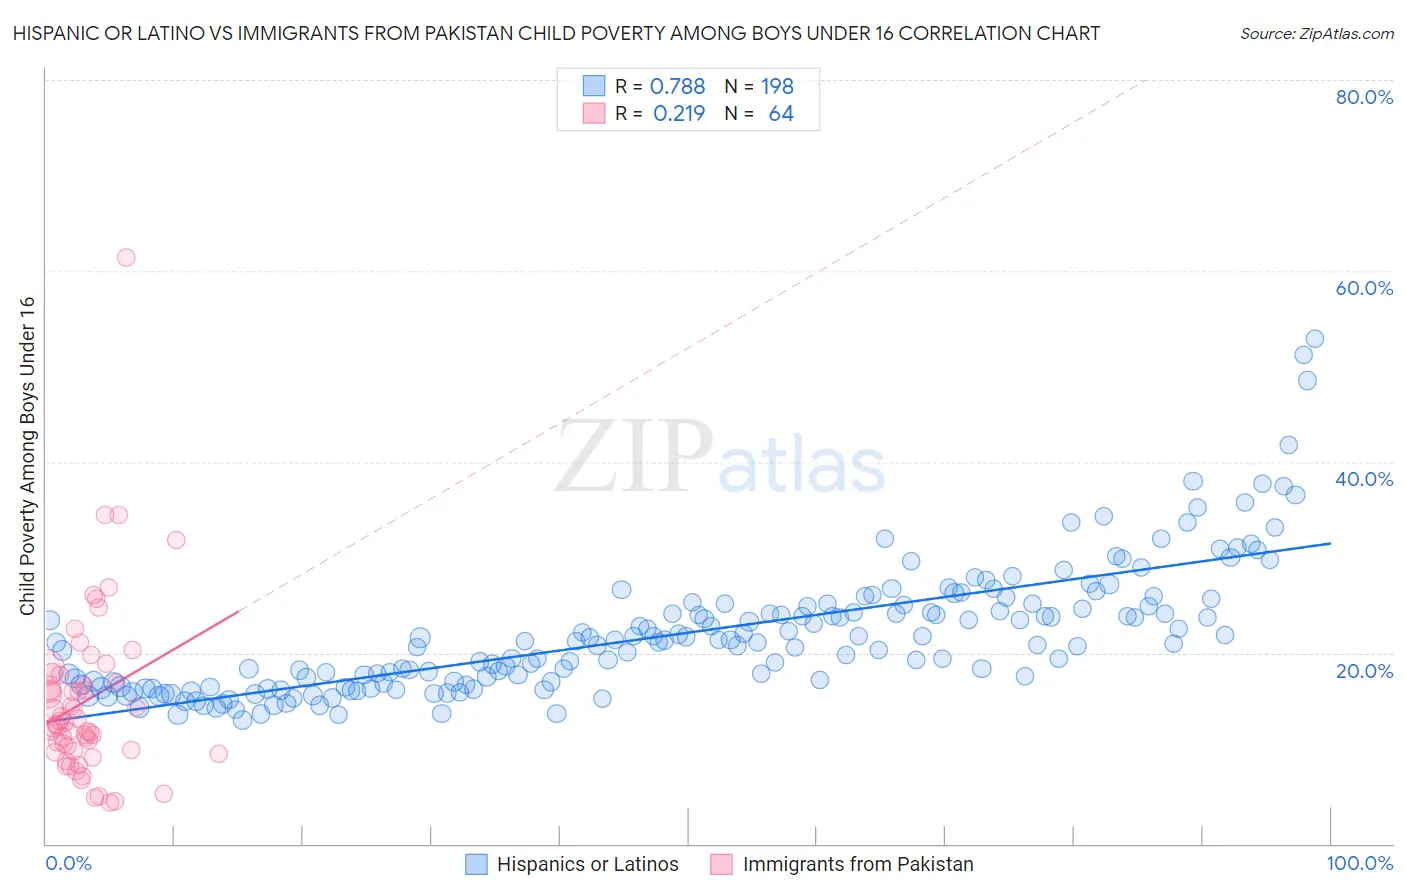
Hispanic or Latino vs Immigrants from Pakistan Child Poverty Among Boys Under 16 Correlation Chart
The statistical analysis conducted on geographies consisting of 554,167,718 people shows a strong positive correlation between the proportion of Hispanics or Latinos and poverty level among boys under the age of 16 in the United States with a correlation coefficient (R) of 0.788 and weighted average of 20.9%. Similarly, the statistical analysis conducted on geographies consisting of 280,699,242 people shows a weak positive correlation between the proportion of Immigrants from Pakistan and poverty level among boys under the age of 16 in the United States with a correlation coefficient (R) of 0.219 and weighted average of 14.3%, a difference of 45.8%.
Child Poverty Among Boys Under 16 Correlation Summary
| Measurement | Hispanic or Latino | Immigrants from Pakistan |
| Minimum | 13.0% | 4.3% |
| Maximum | 53.0% | 61.4% |
| Range | 39.9% | 57.1% |
| Mean | 22.0% | 15.0% |
| Median | 21.1% | 12.6% |
| Interquartile 25% (IQ1) | 16.8% | 9.8% |
| Interquartile 75% (IQ3) | 24.9% | 17.2% |
| Interquartile Range (IQR) | 8.0% | 7.4% |
| Standard Deviation (Sample) | 6.8% | 9.0% |
| Standard Deviation (Population) | 6.8% | 8.9% |
Similar Demographics by Child Poverty Among Boys Under 16
Demographics Similar to Hispanics or Latinos by Child Poverty Among Boys Under 16
In terms of child poverty among boys under 16, the demographic groups most similar to Hispanics or Latinos are Chippewa (21.0%, a difference of 0.26%), Immigrants from Caribbean (21.0%, a difference of 0.53%), Haitian (21.0%, a difference of 0.58%), Indonesian (20.8%, a difference of 0.61%), and Mexican (20.7%, a difference of 0.80%).
| Demographics | Rating | Rank | Child Poverty Among Boys Under 16 |
| Senegalese | 0.0 /100 | #290 | Tragic 20.6% |
| Immigrants | Latin America | 0.0 /100 | #291 | Tragic 20.6% |
| Yaqui | 0.0 /100 | #292 | Tragic 20.7% |
| Immigrants | Senegal | 0.0 /100 | #293 | Tragic 20.7% |
| Immigrants | Bahamas | 0.0 /100 | #294 | Tragic 20.7% |
| Mexicans | 0.0 /100 | #295 | Tragic 20.7% |
| Indonesians | 0.0 /100 | #296 | Tragic 20.8% |
| Hispanics or Latinos | 0.0 /100 | #297 | Tragic 20.9% |
| Chippewa | 0.0 /100 | #298 | Tragic 21.0% |
| Immigrants | Caribbean | 0.0 /100 | #299 | Tragic 21.0% |
| Haitians | 0.0 /100 | #300 | Tragic 21.0% |
| Guatemalans | 0.0 /100 | #301 | Tragic 21.1% |
| Somalis | 0.0 /100 | #302 | Tragic 21.1% |
| Immigrants | Haiti | 0.0 /100 | #303 | Tragic 21.3% |
| Immigrants | Central America | 0.0 /100 | #304 | Tragic 21.3% |
Demographics Similar to Immigrants from Pakistan by Child Poverty Among Boys Under 16
In terms of child poverty among boys under 16, the demographic groups most similar to Immigrants from Pakistan are Zimbabwean (14.3%, a difference of 0.0%), Immigrants from Serbia (14.3%, a difference of 0.050%), Polish (14.4%, a difference of 0.11%), Immigrants from Philippines (14.3%, a difference of 0.13%), and Laotian (14.3%, a difference of 0.17%).
| Demographics | Rating | Rank | Child Poverty Among Boys Under 16 |
| Immigrants | Indonesia | 99.4 /100 | #48 | Exceptional 14.1% |
| Czechs | 99.3 /100 | #49 | Exceptional 14.1% |
| Italians | 99.2 /100 | #50 | Exceptional 14.2% |
| Immigrants | Greece | 99.2 /100 | #51 | Exceptional 14.2% |
| Laotians | 99.0 /100 | #52 | Exceptional 14.3% |
| Immigrants | Philippines | 99.0 /100 | #53 | Exceptional 14.3% |
| Immigrants | Serbia | 99.0 /100 | #54 | Exceptional 14.3% |
| Immigrants | Pakistan | 99.0 /100 | #55 | Exceptional 14.3% |
| Zimbabweans | 99.0 /100 | #56 | Exceptional 14.3% |
| Poles | 98.9 /100 | #57 | Exceptional 14.4% |
| Immigrants | Sweden | 98.9 /100 | #58 | Exceptional 14.4% |
| Immigrants | Czechoslovakia | 98.9 /100 | #59 | Exceptional 14.4% |
| Immigrants | Belgium | 98.9 /100 | #60 | Exceptional 14.4% |
| Scandinavians | 98.8 /100 | #61 | Exceptional 14.4% |
| Immigrants | Israel | 98.7 /100 | #62 | Exceptional 14.4% |