Hawaiian vs Northern European Child Poverty Under the Age of 5
COMPARE
Hawaiian
Northern European
Child Poverty Under the Age of 5
Child Poverty Under the Age of 5 Comparison
Hawaiians
Northern Europeans
17.4%
CHILD POVERTY UNDER THE AGE OF 5
41.5/ 100
METRIC RATING
179th/ 347
METRIC RANK
16.0%
CHILD POVERTY UNDER THE AGE OF 5
94.3/ 100
METRIC RATING
109th/ 347
METRIC RANK
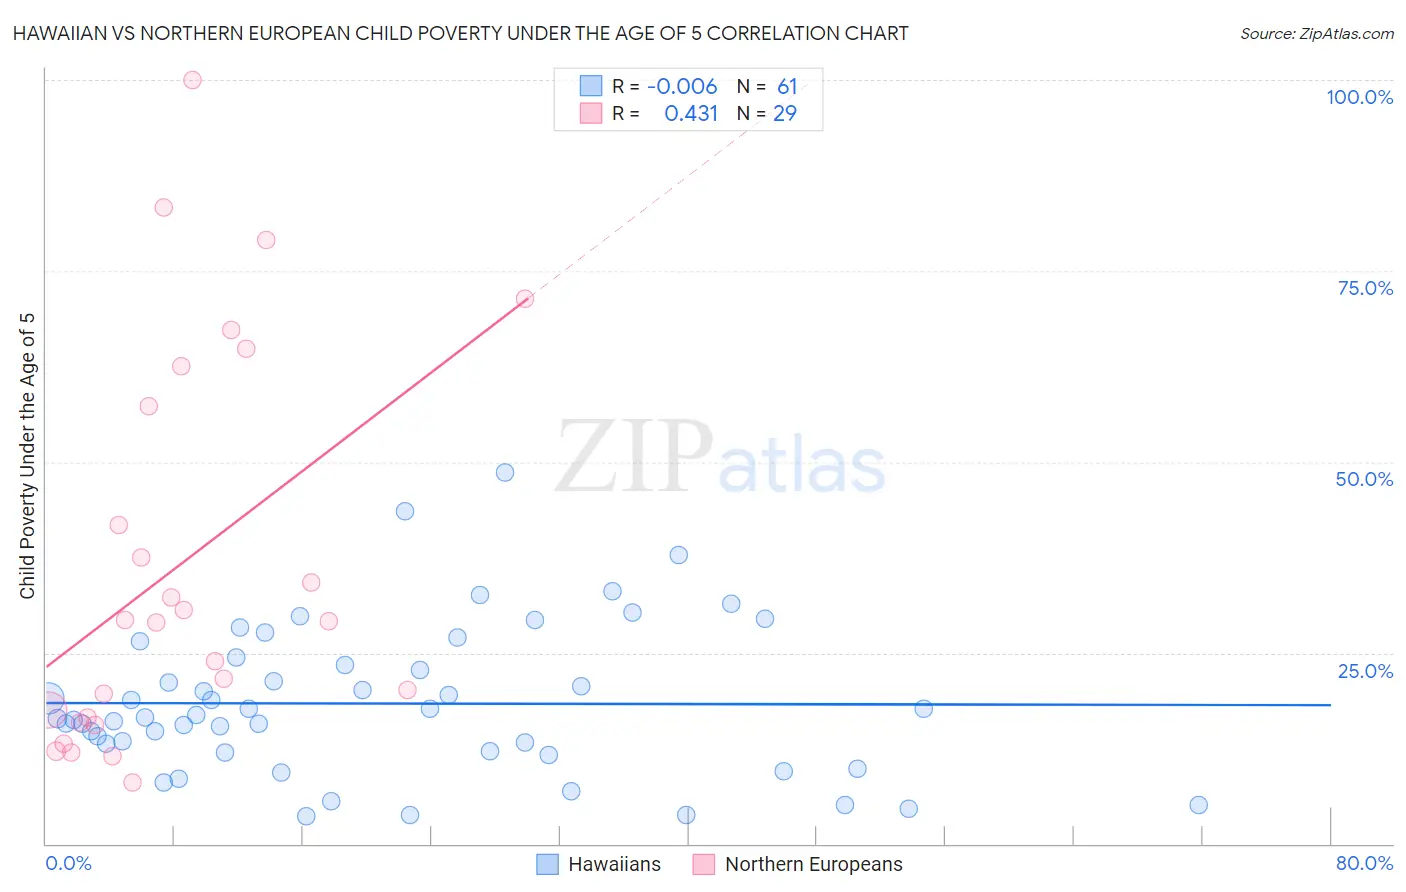
Hawaiian vs Northern European Child Poverty Under the Age of 5 Correlation Chart
The statistical analysis conducted on geographies consisting of 319,559,583 people shows no correlation between the proportion of Hawaiians and poverty level among children under the age of 5 in the United States with a correlation coefficient (R) of -0.006 and weighted average of 17.4%. Similarly, the statistical analysis conducted on geographies consisting of 386,576,339 people shows a moderate positive correlation between the proportion of Northern Europeans and poverty level among children under the age of 5 in the United States with a correlation coefficient (R) of 0.431 and weighted average of 16.0%, a difference of 8.8%.
Child Poverty Under the Age of 5 Correlation Summary
| Measurement | Hawaiian | Northern European |
| Minimum | 3.6% | 8.0% |
| Maximum | 48.5% | 100.0% |
| Range | 44.9% | 92.0% |
| Mean | 18.4% | 36.4% |
| Median | 16.6% | 29.2% |
| Interquartile 25% (IQ1) | 12.0% | 16.2% |
| Interquartile 75% (IQ3) | 23.9% | 59.9% |
| Interquartile Range (IQR) | 11.9% | 43.7% |
| Standard Deviation (Sample) | 9.7% | 25.4% |
| Standard Deviation (Population) | 9.7% | 25.0% |
Similar Demographics by Child Poverty Under the Age of 5
Demographics Similar to Hawaiians by Child Poverty Under the Age of 5
In terms of child poverty under the age of 5, the demographic groups most similar to Hawaiians are South American Indian (17.4%, a difference of 0.010%), Immigrants from Germany (17.4%, a difference of 0.050%), Arab (17.4%, a difference of 0.080%), Lebanese (17.4%, a difference of 0.12%), and Immigrants from Cameroon (17.4%, a difference of 0.13%).
| Demographics | Rating | Rank | Child Poverty Under the Age of 5 |
| Yugoslavians | 54.1 /100 | #172 | Average 17.2% |
| Welsh | 54.0 /100 | #173 | Average 17.2% |
| Immigrants | Saudi Arabia | 50.0 /100 | #174 | Average 17.2% |
| Immigrants | Lebanon | 47.6 /100 | #175 | Average 17.3% |
| Immigrants | Iraq | 45.2 /100 | #176 | Average 17.3% |
| Immigrants | Sierra Leone | 43.6 /100 | #177 | Average 17.3% |
| Immigrants | Cameroon | 42.7 /100 | #178 | Average 17.4% |
| Hawaiians | 41.5 /100 | #179 | Average 17.4% |
| South American Indians | 41.4 /100 | #180 | Average 17.4% |
| Immigrants | Germany | 41.0 /100 | #181 | Average 17.4% |
| Arabs | 40.7 /100 | #182 | Average 17.4% |
| Lebanese | 40.3 /100 | #183 | Average 17.4% |
| Immigrants | Costa Rica | 39.0 /100 | #184 | Fair 17.4% |
| Immigrants | Armenia | 38.0 /100 | #185 | Fair 17.5% |
| Immigrants | Bosnia and Herzegovina | 35.0 /100 | #186 | Fair 17.5% |
Demographics Similar to Northern Europeans by Child Poverty Under the Age of 5
In terms of child poverty under the age of 5, the demographic groups most similar to Northern Europeans are Romanian (16.0%, a difference of 0.010%), Pakistani (16.0%, a difference of 0.040%), Immigrants from Brazil (16.0%, a difference of 0.080%), Slovene (16.0%, a difference of 0.090%), and Peruvian (16.0%, a difference of 0.10%).
| Demographics | Rating | Rank | Child Poverty Under the Age of 5 |
| Armenians | 95.7 /100 | #102 | Exceptional 15.8% |
| Europeans | 95.3 /100 | #103 | Exceptional 15.9% |
| Immigrants | North America | 94.9 /100 | #104 | Exceptional 15.9% |
| Immigrants | Spain | 94.8 /100 | #105 | Exceptional 15.9% |
| Tlingit-Haida | 94.7 /100 | #106 | Exceptional 15.9% |
| Slovenes | 94.4 /100 | #107 | Exceptional 16.0% |
| Immigrants | Brazil | 94.4 /100 | #108 | Exceptional 16.0% |
| Northern Europeans | 94.3 /100 | #109 | Exceptional 16.0% |
| Romanians | 94.3 /100 | #110 | Exceptional 16.0% |
| Pakistanis | 94.2 /100 | #111 | Exceptional 16.0% |
| Peruvians | 94.1 /100 | #112 | Exceptional 16.0% |
| Puget Sound Salish | 94.1 /100 | #113 | Exceptional 16.0% |
| Immigrants | Kuwait | 93.9 /100 | #114 | Exceptional 16.0% |
| Albanians | 93.8 /100 | #115 | Exceptional 16.0% |
| Immigrants | Austria | 93.5 /100 | #116 | Exceptional 16.0% |