Ghanaian vs Immigrants from Iraq Poverty
COMPARE
Ghanaian
Immigrants from Iraq
Poverty
Poverty Comparison
Ghanaians
Immigrants from Iraq
13.9%
POVERTY
0.5/ 100
METRIC RATING
238th/ 347
METRIC RANK
12.4%
POVERTY
40.2/ 100
METRIC RATING
183rd/ 347
METRIC RANK
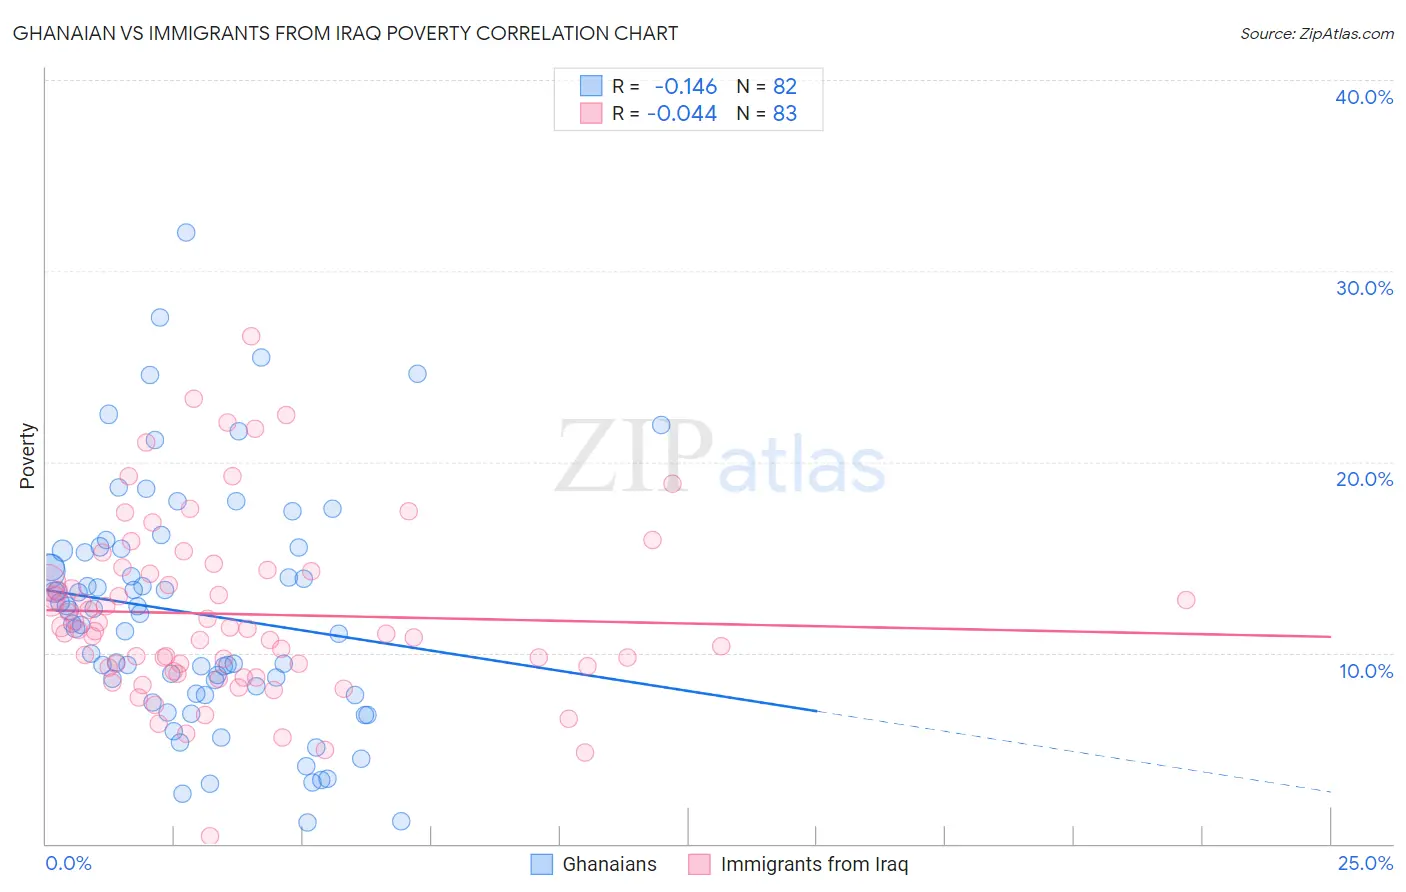
Ghanaian vs Immigrants from Iraq Poverty Correlation Chart
The statistical analysis conducted on geographies consisting of 190,556,077 people shows a poor negative correlation between the proportion of Ghanaians and poverty level in the United States with a correlation coefficient (R) of -0.146 and weighted average of 13.9%. Similarly, the statistical analysis conducted on geographies consisting of 194,714,900 people shows no correlation between the proportion of Immigrants from Iraq and poverty level in the United States with a correlation coefficient (R) of -0.044 and weighted average of 12.4%, a difference of 11.7%.
Poverty Correlation Summary
| Measurement | Ghanaian | Immigrants from Iraq |
| Minimum | 1.1% | 0.40% |
| Maximum | 32.0% | 26.6% |
| Range | 30.9% | 26.2% |
| Mean | 12.1% | 12.0% |
| Median | 11.8% | 11.2% |
| Interquartile 25% (IQ1) | 7.9% | 9.3% |
| Interquartile 75% (IQ3) | 15.4% | 14.3% |
| Interquartile Range (IQR) | 7.5% | 5.0% |
| Standard Deviation (Sample) | 6.2% | 4.6% |
| Standard Deviation (Population) | 6.2% | 4.6% |
Similar Demographics by Poverty
Demographics Similar to Ghanaians by Poverty
In terms of poverty, the demographic groups most similar to Ghanaians are French American Indian (13.9%, a difference of 0.13%), Immigrants from Armenia (13.9%, a difference of 0.15%), Cuban (13.9%, a difference of 0.19%), Nicaraguan (13.9%, a difference of 0.35%), and Immigrants from Middle Africa (14.0%, a difference of 0.47%).
| Demographics | Rating | Rank | Poverty |
| Nigerians | 1.4 /100 | #231 | Tragic 13.6% |
| Fijians | 0.8 /100 | #232 | Tragic 13.7% |
| Immigrants | Saudi Arabia | 0.8 /100 | #233 | Tragic 13.8% |
| Immigrants | Laos | 0.7 /100 | #234 | Tragic 13.8% |
| Cubans | 0.6 /100 | #235 | Tragic 13.9% |
| Immigrants | Armenia | 0.5 /100 | #236 | Tragic 13.9% |
| French American Indians | 0.5 /100 | #237 | Tragic 13.9% |
| Ghanaians | 0.5 /100 | #238 | Tragic 13.9% |
| Nicaraguans | 0.4 /100 | #239 | Tragic 13.9% |
| Immigrants | Middle Africa | 0.4 /100 | #240 | Tragic 14.0% |
| Salvadorans | 0.4 /100 | #241 | Tragic 14.0% |
| Ecuadorians | 0.4 /100 | #242 | Tragic 14.0% |
| Sudanese | 0.3 /100 | #243 | Tragic 14.0% |
| Nepalese | 0.3 /100 | #244 | Tragic 14.0% |
| Immigrants | Sudan | 0.3 /100 | #245 | Tragic 14.1% |
Demographics Similar to Immigrants from Iraq by Poverty
In terms of poverty, the demographic groups most similar to Immigrants from Iraq are Kenyan (12.5%, a difference of 0.13%), Immigrants from Cameroon (12.4%, a difference of 0.15%), Immigrants from Afghanistan (12.4%, a difference of 0.19%), Mongolian (12.4%, a difference of 0.34%), and Immigrants from Morocco (12.4%, a difference of 0.38%).
| Demographics | Rating | Rank | Poverty |
| Immigrants | Colombia | 47.7 /100 | #176 | Average 12.3% |
| Immigrants | Syria | 47.5 /100 | #177 | Average 12.3% |
| Uruguayans | 44.7 /100 | #178 | Average 12.4% |
| Immigrants | Morocco | 44.0 /100 | #179 | Average 12.4% |
| Mongolians | 43.6 /100 | #180 | Average 12.4% |
| Immigrants | Afghanistan | 42.1 /100 | #181 | Average 12.4% |
| Immigrants | Cameroon | 41.7 /100 | #182 | Average 12.4% |
| Immigrants | Iraq | 40.2 /100 | #183 | Average 12.4% |
| Kenyans | 38.8 /100 | #184 | Fair 12.5% |
| Israelis | 36.4 /100 | #185 | Fair 12.5% |
| Immigrants | Sierra Leone | 36.3 /100 | #186 | Fair 12.5% |
| Hawaiians | 34.1 /100 | #187 | Fair 12.5% |
| Immigrants | Costa Rica | 33.3 /100 | #188 | Fair 12.5% |
| Aleuts | 33.2 /100 | #189 | Fair 12.5% |
| Immigrants | South America | 32.3 /100 | #190 | Fair 12.5% |