Filipino vs Romanian Seniors Poverty Over the Age of 75
COMPARE
Filipino
Romanian
Seniors Poverty Over the Age of 75
Seniors Poverty Over the Age of 75 Comparison
Filipinos
Romanians
11.4%
SENIORS POVERTY OVER THE AGE OF 75
95.5/ 100
METRIC RATING
79th/ 347
METRIC RANK
11.6%
SENIORS POVERTY OVER THE AGE OF 75
92.3/ 100
METRIC RATING
97th/ 347
METRIC RANK
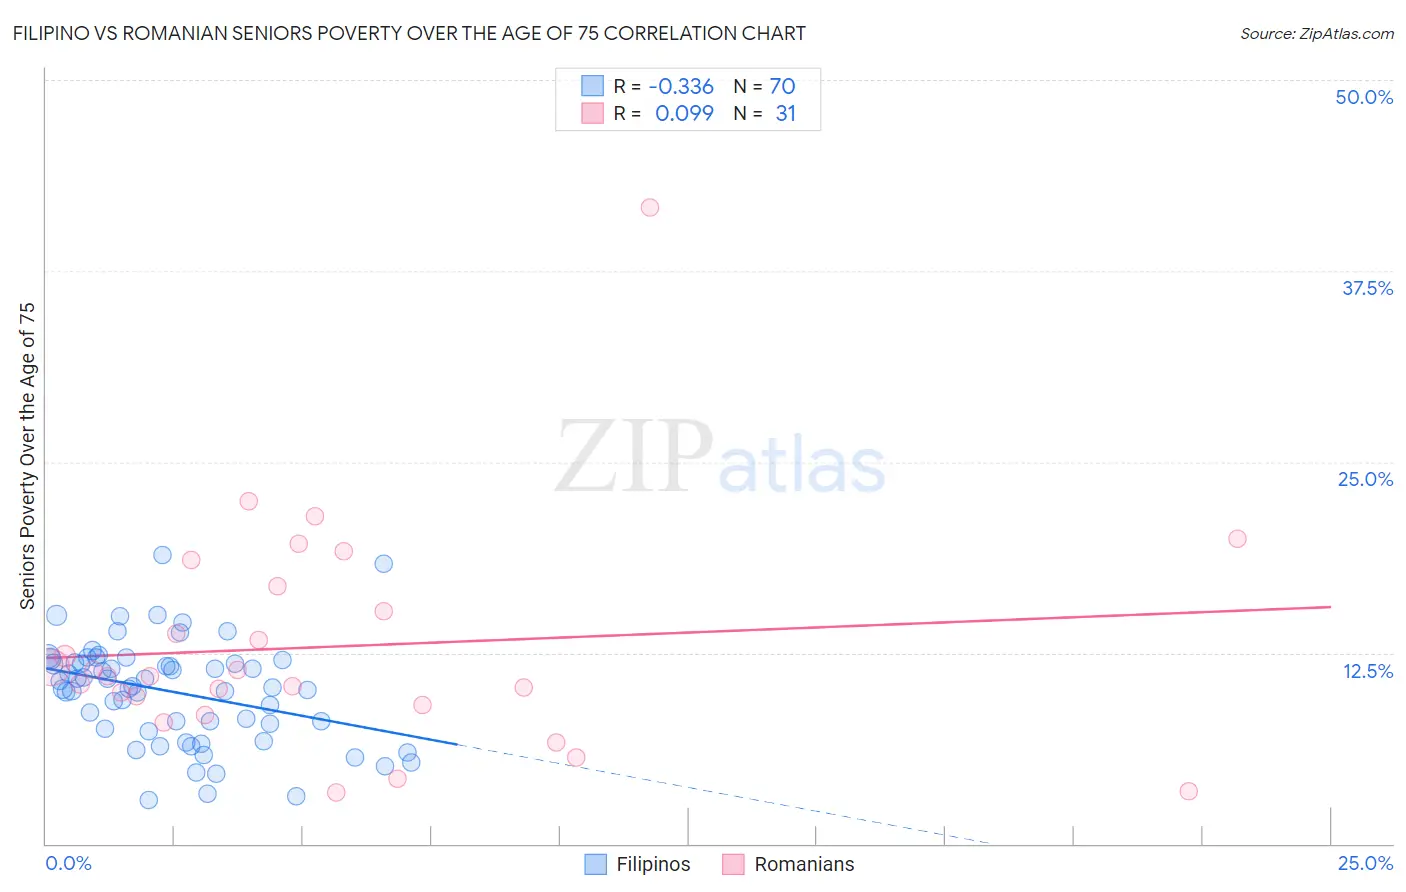
Filipino vs Romanian Seniors Poverty Over the Age of 75 Correlation Chart
The statistical analysis conducted on geographies consisting of 252,177,792 people shows a mild negative correlation between the proportion of Filipinos and poverty level among seniors over the age of 75 in the United States with a correlation coefficient (R) of -0.336 and weighted average of 11.4%. Similarly, the statistical analysis conducted on geographies consisting of 373,710,201 people shows a slight positive correlation between the proportion of Romanians and poverty level among seniors over the age of 75 in the United States with a correlation coefficient (R) of 0.099 and weighted average of 11.6%, a difference of 1.2%.
Seniors Poverty Over the Age of 75 Correlation Summary
| Measurement | Filipino | Romanian |
| Minimum | 2.8% | 3.3% |
| Maximum | 18.9% | 41.7% |
| Range | 16.1% | 38.3% |
| Mean | 9.9% | 12.9% |
| Median | 10.3% | 11.0% |
| Interquartile 25% (IQ1) | 7.5% | 9.1% |
| Interquartile 75% (IQ3) | 11.8% | 16.9% |
| Interquartile Range (IQR) | 4.3% | 7.8% |
| Standard Deviation (Sample) | 3.3% | 7.4% |
| Standard Deviation (Population) | 3.3% | 7.3% |
Demographics Similar to Filipinos and Romanians by Seniors Poverty Over the Age of 75
In terms of seniors poverty over the age of 75, the demographic groups most similar to Filipinos are Macedonian (11.4%, a difference of 0.0%), Alaska Native (11.4%, a difference of 0.060%), Basque (11.5%, a difference of 0.17%), Iranian (11.5%, a difference of 0.19%), and Immigrants from South Africa (11.5%, a difference of 0.27%). Similarly, the demographic groups most similar to Romanians are Immigrants from Bosnia and Herzegovina (11.6%, a difference of 0.080%), Immigrants from Sweden (11.6%, a difference of 0.080%), Immigrants from Japan (11.6%, a difference of 0.11%), Creek (11.6%, a difference of 0.13%), and Immigrants from Poland (11.6%, a difference of 0.17%).
| Demographics | Rating | Rank | Seniors Poverty Over the Age of 75 |
| Macedonians | 95.5 /100 | #78 | Exceptional 11.4% |
| Filipinos | 95.5 /100 | #79 | Exceptional 11.4% |
| Alaska Natives | 95.4 /100 | #80 | Exceptional 11.4% |
| Basques | 95.1 /100 | #81 | Exceptional 11.5% |
| Iranians | 95.1 /100 | #82 | Exceptional 11.5% |
| Immigrants | South Africa | 94.9 /100 | #83 | Exceptional 11.5% |
| Immigrants | Iraq | 94.9 /100 | #84 | Exceptional 11.5% |
| Immigrants | Bulgaria | 94.7 /100 | #85 | Exceptional 11.5% |
| Australians | 94.6 /100 | #86 | Exceptional 11.5% |
| Koreans | 94.5 /100 | #87 | Exceptional 11.5% |
| Immigrants | Croatia | 94.5 /100 | #88 | Exceptional 11.5% |
| Immigrants | Sri Lanka | 94.4 /100 | #89 | Exceptional 11.5% |
| Aleuts | 94.1 /100 | #90 | Exceptional 11.5% |
| Immigrants | Germany | 94.1 /100 | #91 | Exceptional 11.5% |
| Kenyans | 93.9 /100 | #92 | Exceptional 11.5% |
| Immigrants | Poland | 92.9 /100 | #93 | Exceptional 11.6% |
| Creek | 92.7 /100 | #94 | Exceptional 11.6% |
| Immigrants | Bosnia and Herzegovina | 92.6 /100 | #95 | Exceptional 11.6% |
| Immigrants | Sweden | 92.6 /100 | #96 | Exceptional 11.6% |
| Romanians | 92.3 /100 | #97 | Exceptional 11.6% |
| Immigrants | Japan | 91.9 /100 | #98 | Exceptional 11.6% |