Filipino vs Immigrants from Turkey Seniors Poverty Over the Age of 75
COMPARE
Filipino
Immigrants from Turkey
Seniors Poverty Over the Age of 75
Seniors Poverty Over the Age of 75 Comparison
Filipinos
Immigrants from Turkey
11.4%
SENIORS POVERTY OVER THE AGE OF 75
95.5/ 100
METRIC RATING
79th/ 347
METRIC RANK
12.0%
SENIORS POVERTY OVER THE AGE OF 75
64.7/ 100
METRIC RATING
153rd/ 347
METRIC RANK
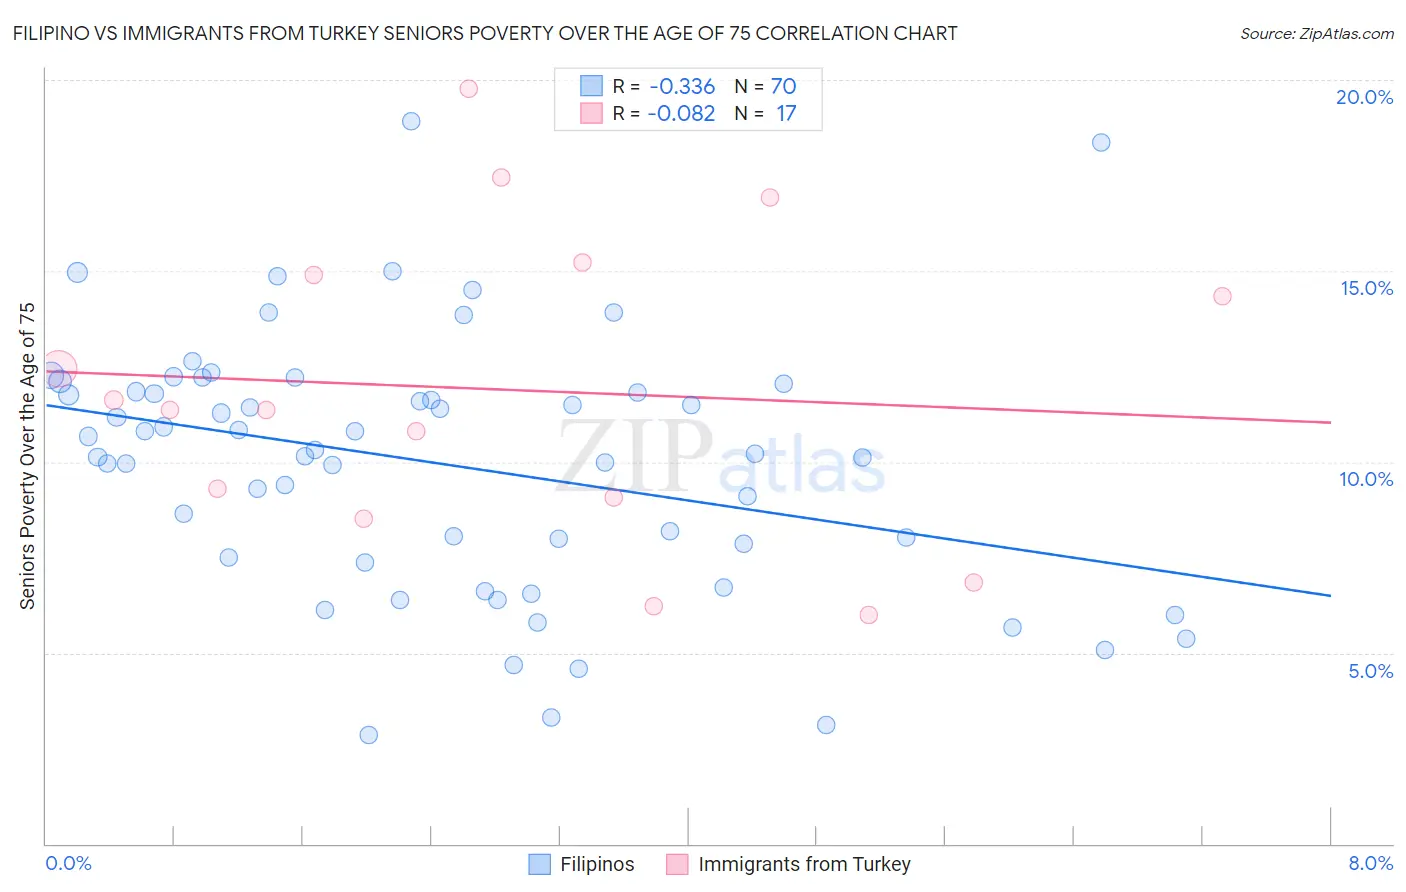
Filipino vs Immigrants from Turkey Seniors Poverty Over the Age of 75 Correlation Chart
The statistical analysis conducted on geographies consisting of 252,177,792 people shows a mild negative correlation between the proportion of Filipinos and poverty level among seniors over the age of 75 in the United States with a correlation coefficient (R) of -0.336 and weighted average of 11.4%. Similarly, the statistical analysis conducted on geographies consisting of 221,368,825 people shows a slight negative correlation between the proportion of Immigrants from Turkey and poverty level among seniors over the age of 75 in the United States with a correlation coefficient (R) of -0.082 and weighted average of 12.0%, a difference of 5.3%.
Seniors Poverty Over the Age of 75 Correlation Summary
| Measurement | Filipino | Immigrants from Turkey |
| Minimum | 2.8% | 6.0% |
| Maximum | 18.9% | 19.8% |
| Range | 16.1% | 13.8% |
| Mean | 9.9% | 11.9% |
| Median | 10.3% | 11.4% |
| Interquartile 25% (IQ1) | 7.5% | 8.8% |
| Interquartile 75% (IQ3) | 11.8% | 15.1% |
| Interquartile Range (IQR) | 4.3% | 6.3% |
| Standard Deviation (Sample) | 3.3% | 4.1% |
| Standard Deviation (Population) | 3.3% | 3.9% |
Similar Demographics by Seniors Poverty Over the Age of 75
Demographics Similar to Filipinos by Seniors Poverty Over the Age of 75
In terms of seniors poverty over the age of 75, the demographic groups most similar to Filipinos are Macedonian (11.4%, a difference of 0.0%), White/Caucasian (11.4%, a difference of 0.020%), Alaska Native (11.4%, a difference of 0.060%), French Canadian (11.4%, a difference of 0.10%), and Palestinian (11.4%, a difference of 0.16%).
| Demographics | Rating | Rank | Seniors Poverty Over the Age of 75 |
| Sierra Leoneans | 96.1 /100 | #72 | Exceptional 11.4% |
| Immigrants | Micronesia | 96.0 /100 | #73 | Exceptional 11.4% |
| Delaware | 96.0 /100 | #74 | Exceptional 11.4% |
| Palestinians | 95.8 /100 | #75 | Exceptional 11.4% |
| French Canadians | 95.7 /100 | #76 | Exceptional 11.4% |
| Whites/Caucasians | 95.5 /100 | #77 | Exceptional 11.4% |
| Macedonians | 95.5 /100 | #78 | Exceptional 11.4% |
| Filipinos | 95.5 /100 | #79 | Exceptional 11.4% |
| Alaska Natives | 95.4 /100 | #80 | Exceptional 11.4% |
| Basques | 95.1 /100 | #81 | Exceptional 11.5% |
| Iranians | 95.1 /100 | #82 | Exceptional 11.5% |
| Immigrants | South Africa | 94.9 /100 | #83 | Exceptional 11.5% |
| Immigrants | Iraq | 94.9 /100 | #84 | Exceptional 11.5% |
| Immigrants | Bulgaria | 94.7 /100 | #85 | Exceptional 11.5% |
| Australians | 94.6 /100 | #86 | Exceptional 11.5% |
Demographics Similar to Immigrants from Turkey by Seniors Poverty Over the Age of 75
In terms of seniors poverty over the age of 75, the demographic groups most similar to Immigrants from Turkey are Cambodian (12.0%, a difference of 0.060%), Immigrants from Korea (12.0%, a difference of 0.080%), Cherokee (12.0%, a difference of 0.10%), Indonesian (12.1%, a difference of 0.18%), and Immigrants from Burma/Myanmar (12.1%, a difference of 0.21%).
| Demographics | Rating | Rank | Seniors Poverty Over the Age of 75 |
| Bangladeshis | 70.4 /100 | #146 | Good 12.0% |
| Immigrants | Latvia | 69.1 /100 | #147 | Good 12.0% |
| Immigrants | Zaire | 67.6 /100 | #148 | Good 12.0% |
| Asians | 67.4 /100 | #149 | Good 12.0% |
| Cypriots | 67.3 /100 | #150 | Good 12.0% |
| Cherokee | 65.8 /100 | #151 | Good 12.0% |
| Immigrants | Korea | 65.5 /100 | #152 | Good 12.0% |
| Immigrants | Turkey | 64.7 /100 | #153 | Good 12.0% |
| Cambodians | 64.0 /100 | #154 | Good 12.0% |
| Indonesians | 62.6 /100 | #155 | Good 12.1% |
| Immigrants | Burma/Myanmar | 62.3 /100 | #156 | Good 12.1% |
| Immigrants | Sudan | 61.7 /100 | #157 | Good 12.1% |
| Portuguese | 61.3 /100 | #158 | Good 12.1% |
| Immigrants | Middle Africa | 61.2 /100 | #159 | Good 12.1% |
| Immigrants | Eastern Africa | 60.9 /100 | #160 | Good 12.1% |