European vs Malaysian Child Poverty Under the Age of 16
COMPARE
European
Malaysian
Child Poverty Under the Age of 16
Child Poverty Under the Age of 16 Comparison
Europeans
Malaysians
14.3%
CHILD POVERTY UNDER THE AGE OF 16
98.1/ 100
METRIC RATING
67th/ 347
METRIC RANK
17.5%
CHILD POVERTY UNDER THE AGE OF 16
5.9/ 100
METRIC RATING
215th/ 347
METRIC RANK
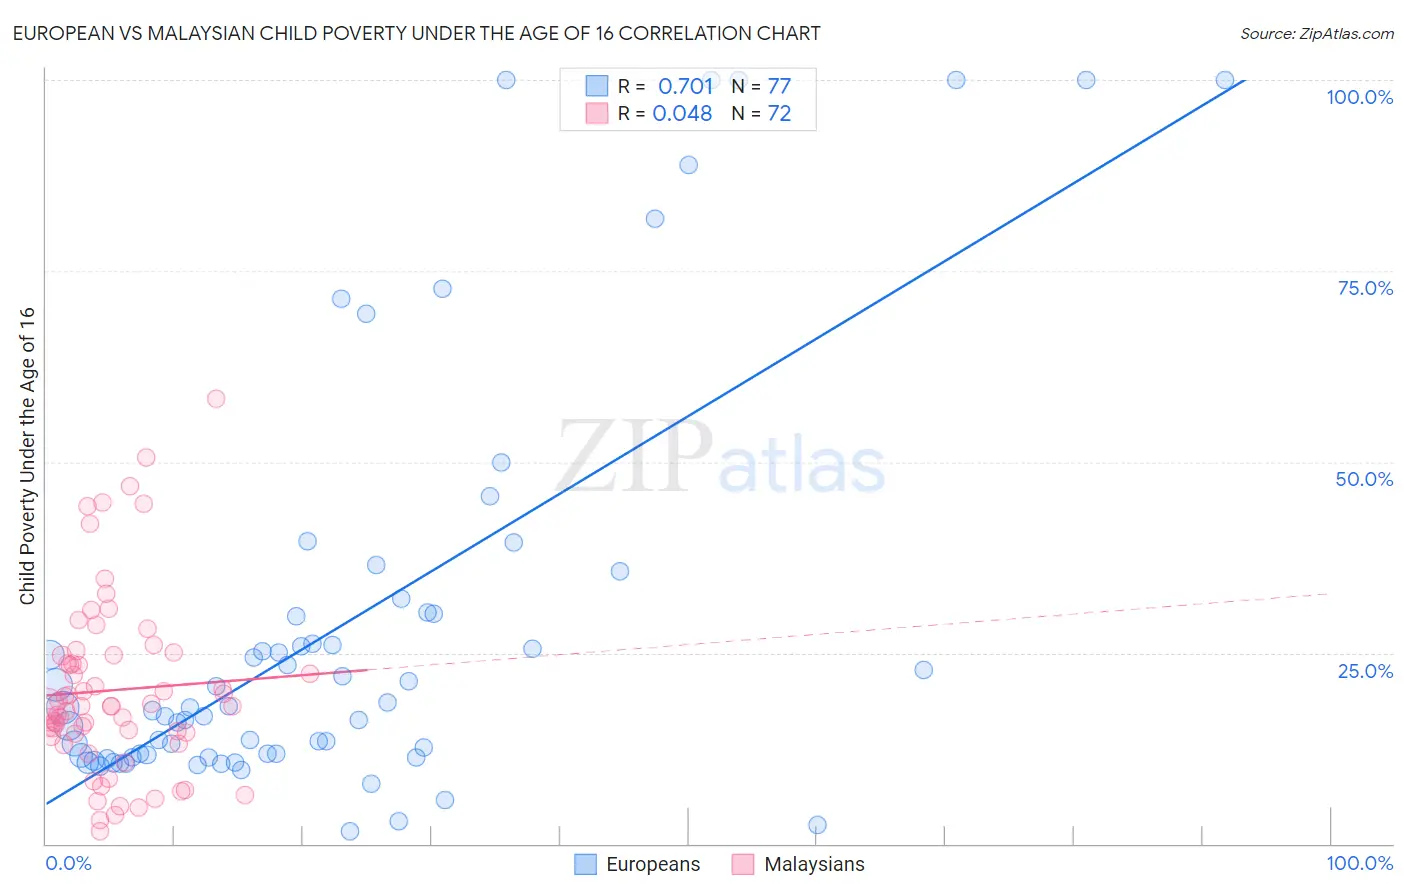
European vs Malaysian Child Poverty Under the Age of 16 Correlation Chart
The statistical analysis conducted on geographies consisting of 550,263,895 people shows a strong positive correlation between the proportion of Europeans and poverty level among children under the age of 16 in the United States with a correlation coefficient (R) of 0.701 and weighted average of 14.3%. Similarly, the statistical analysis conducted on geographies consisting of 225,232,766 people shows no correlation between the proportion of Malaysians and poverty level among children under the age of 16 in the United States with a correlation coefficient (R) of 0.048 and weighted average of 17.5%, a difference of 22.8%.
Child Poverty Under the Age of 16 Correlation Summary
| Measurement | European | Malaysian |
| Minimum | 1.6% | 1.6% |
| Maximum | 100.0% | 58.3% |
| Range | 98.4% | 56.8% |
| Mean | 28.5% | 20.1% |
| Median | 17.8% | 18.0% |
| Interquartile 25% (IQ1) | 11.5% | 14.2% |
| Interquartile 75% (IQ3) | 30.2% | 24.6% |
| Interquartile Range (IQR) | 18.8% | 10.4% |
| Standard Deviation (Sample) | 27.2% | 11.7% |
| Standard Deviation (Population) | 27.0% | 11.6% |
Similar Demographics by Child Poverty Under the Age of 16
Demographics Similar to Europeans by Child Poverty Under the Age of 16
In terms of child poverty under the age of 16, the demographic groups most similar to Europeans are Slovene (14.3%, a difference of 0.030%), Laotian (14.3%, a difference of 0.10%), Immigrants from Bulgaria (14.3%, a difference of 0.18%), Immigrants from Philippines (14.3%, a difference of 0.21%), and Immigrants from Netherlands (14.3%, a difference of 0.28%).
| Demographics | Rating | Rank | Child Poverty Under the Age of 16 |
| Immigrants | Austria | 98.5 /100 | #60 | Exceptional 14.2% |
| Immigrants | Sweden | 98.5 /100 | #61 | Exceptional 14.2% |
| Zimbabweans | 98.5 /100 | #62 | Exceptional 14.2% |
| Immigrants | Europe | 98.4 /100 | #63 | Exceptional 14.2% |
| Immigrants | Romania | 98.3 /100 | #64 | Exceptional 14.2% |
| Immigrants | Philippines | 98.2 /100 | #65 | Exceptional 14.3% |
| Slovenes | 98.1 /100 | #66 | Exceptional 14.3% |
| Europeans | 98.1 /100 | #67 | Exceptional 14.3% |
| Laotians | 98.0 /100 | #68 | Exceptional 14.3% |
| Immigrants | Bulgaria | 98.0 /100 | #69 | Exceptional 14.3% |
| Immigrants | Netherlands | 97.9 /100 | #70 | Exceptional 14.3% |
| Immigrants | Poland | 97.9 /100 | #71 | Exceptional 14.3% |
| Cambodians | 97.8 /100 | #72 | Exceptional 14.4% |
| Immigrants | Turkey | 97.6 /100 | #73 | Exceptional 14.4% |
| Macedonians | 97.6 /100 | #74 | Exceptional 14.4% |
Demographics Similar to Malaysians by Child Poverty Under the Age of 16
In terms of child poverty under the age of 16, the demographic groups most similar to Malaysians are Iraqi (17.5%, a difference of 0.020%), Sierra Leonean (17.6%, a difference of 0.12%), Immigrants from the Azores (17.5%, a difference of 0.14%), Immigrants from Eastern Africa (17.6%, a difference of 0.30%), and Immigrants (17.5%, a difference of 0.31%).
| Demographics | Rating | Rank | Child Poverty Under the Age of 16 |
| Pennsylvania Germans | 7.5 /100 | #208 | Tragic 17.4% |
| Panamanians | 6.9 /100 | #209 | Tragic 17.5% |
| Alaskan Athabascans | 6.9 /100 | #210 | Tragic 17.5% |
| Immigrants | Thailand | 6.6 /100 | #211 | Tragic 17.5% |
| Immigrants | Immigrants | 6.5 /100 | #212 | Tragic 17.5% |
| Immigrants | Azores | 6.2 /100 | #213 | Tragic 17.5% |
| Iraqis | 5.9 /100 | #214 | Tragic 17.5% |
| Malaysians | 5.9 /100 | #215 | Tragic 17.5% |
| Sierra Leoneans | 5.7 /100 | #216 | Tragic 17.6% |
| Immigrants | Eastern Africa | 5.3 /100 | #217 | Tragic 17.6% |
| Moroccans | 5.3 /100 | #218 | Tragic 17.6% |
| Japanese | 4.7 /100 | #219 | Tragic 17.7% |
| Immigrants | Panama | 4.1 /100 | #220 | Tragic 17.7% |
| Cubans | 3.7 /100 | #221 | Tragic 17.8% |
| Immigrants | Armenia | 3.6 /100 | #222 | Tragic 17.8% |