English vs Immigrants from Russia Child Poverty Under the Age of 5
COMPARE
English
Immigrants from Russia
Child Poverty Under the Age of 5
Child Poverty Under the Age of 5 Comparison
English
Immigrants from Russia
16.8%
CHILD POVERTY UNDER THE AGE OF 5
70.4/ 100
METRIC RATING
161st/ 347
METRIC RANK
15.0%
CHILD POVERTY UNDER THE AGE OF 5
99.3/ 100
METRIC RATING
60th/ 347
METRIC RANK
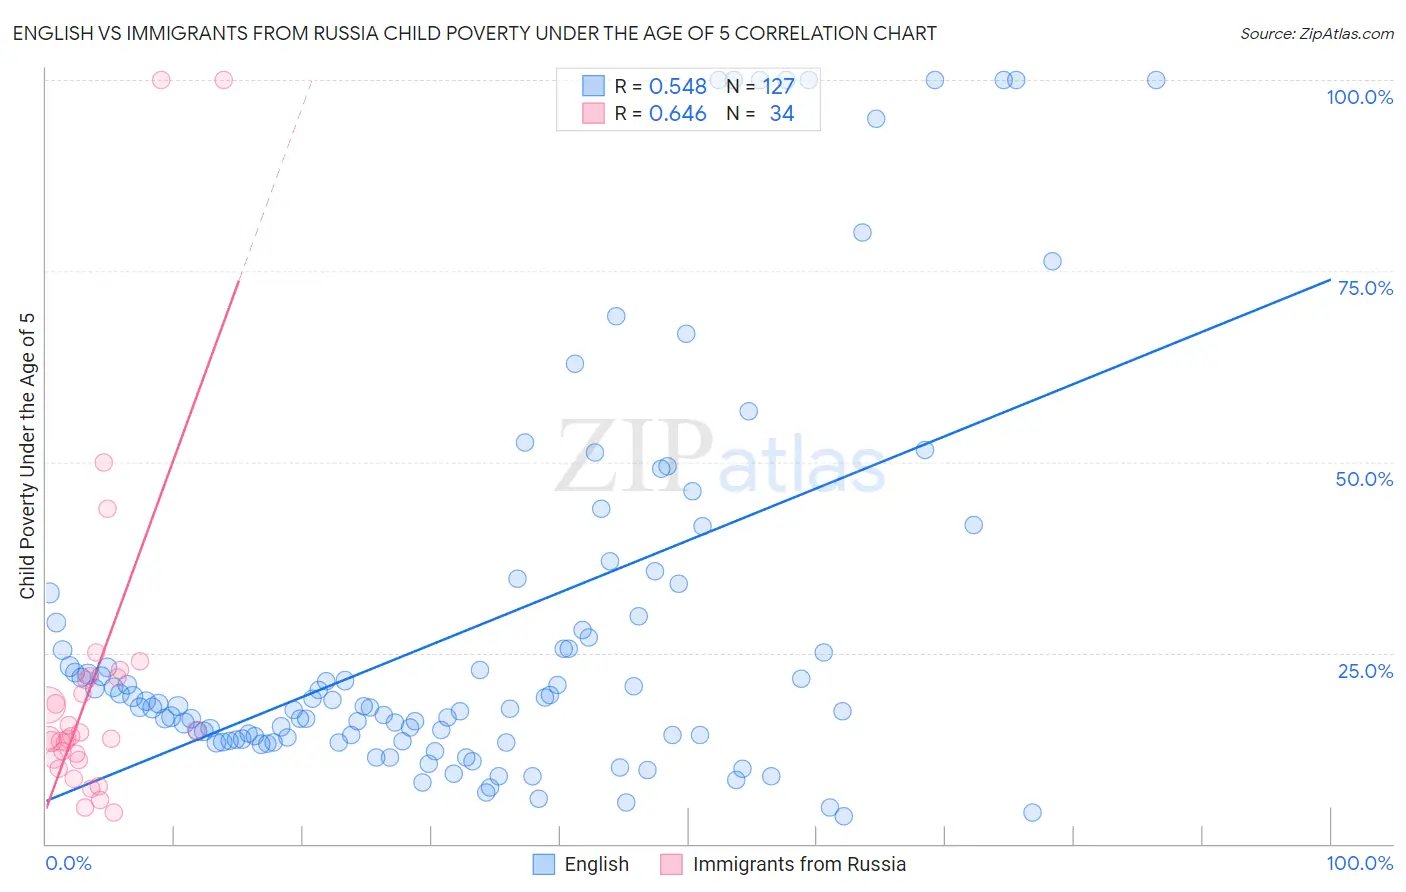
English vs Immigrants from Russia Child Poverty Under the Age of 5 Correlation Chart
The statistical analysis conducted on geographies consisting of 535,899,350 people shows a substantial positive correlation between the proportion of English and poverty level among children under the age of 5 in the United States with a correlation coefficient (R) of 0.548 and weighted average of 16.8%. Similarly, the statistical analysis conducted on geographies consisting of 333,234,763 people shows a significant positive correlation between the proportion of Immigrants from Russia and poverty level among children under the age of 5 in the United States with a correlation coefficient (R) of 0.646 and weighted average of 15.0%, a difference of 12.4%.
Child Poverty Under the Age of 5 Correlation Summary
| Measurement | English | Immigrants from Russia |
| Minimum | 3.5% | 4.0% |
| Maximum | 100.0% | 100.0% |
| Range | 96.5% | 96.0% |
| Mean | 28.1% | 21.2% |
| Median | 18.0% | 14.0% |
| Interquartile 25% (IQ1) | 13.6% | 11.1% |
| Interquartile 75% (IQ3) | 29.0% | 21.7% |
| Interquartile Range (IQR) | 15.4% | 10.6% |
| Standard Deviation (Sample) | 25.5% | 22.1% |
| Standard Deviation (Population) | 25.4% | 21.8% |
Similar Demographics by Child Poverty Under the Age of 5
Demographics Similar to English by Child Poverty Under the Age of 5
In terms of child poverty under the age of 5, the demographic groups most similar to English are Costa Rican (16.9%, a difference of 0.060%), Scottish (16.9%, a difference of 0.21%), Irish (16.8%, a difference of 0.22%), Immigrants from Syria (16.8%, a difference of 0.25%), and Czechoslovakian (16.8%, a difference of 0.28%).
| Demographics | Rating | Rank | Child Poverty Under the Age of 5 |
| Immigrants | Venezuela | 76.0 /100 | #154 | Good 16.7% |
| South Americans | 75.1 /100 | #155 | Good 16.7% |
| Afghans | 74.4 /100 | #156 | Good 16.8% |
| Venezuelans | 73.7 /100 | #157 | Good 16.8% |
| Czechoslovakians | 72.5 /100 | #158 | Good 16.8% |
| Immigrants | Syria | 72.3 /100 | #159 | Good 16.8% |
| Irish | 72.0 /100 | #160 | Good 16.8% |
| English | 70.4 /100 | #161 | Good 16.8% |
| Costa Ricans | 69.8 /100 | #162 | Good 16.9% |
| Scottish | 68.6 /100 | #163 | Good 16.9% |
| Immigrants | Oceania | 67.6 /100 | #164 | Good 16.9% |
| Immigrants | Colombia | 66.9 /100 | #165 | Good 16.9% |
| Slavs | 64.0 /100 | #166 | Good 17.0% |
| Immigrants | Uzbekistan | 62.0 /100 | #167 | Good 17.0% |
| Uruguayans | 60.5 /100 | #168 | Good 17.0% |
Demographics Similar to Immigrants from Russia by Child Poverty Under the Age of 5
In terms of child poverty under the age of 5, the demographic groups most similar to Immigrants from Russia are Paraguayan (15.0%, a difference of 0.090%), Swedish (15.0%, a difference of 0.24%), Egyptian (14.9%, a difference of 0.29%), Immigrants from Pakistan (14.9%, a difference of 0.37%), and Danish (14.9%, a difference of 0.44%).
| Demographics | Rating | Rank | Child Poverty Under the Age of 5 |
| Luxembourgers | 99.4 /100 | #53 | Exceptional 14.9% |
| Immigrants | Israel | 99.4 /100 | #54 | Exceptional 14.9% |
| Danes | 99.4 /100 | #55 | Exceptional 14.9% |
| Immigrants | Pakistan | 99.4 /100 | #56 | Exceptional 14.9% |
| Egyptians | 99.4 /100 | #57 | Exceptional 14.9% |
| Swedes | 99.4 /100 | #58 | Exceptional 15.0% |
| Paraguayans | 99.4 /100 | #59 | Exceptional 15.0% |
| Immigrants | Russia | 99.3 /100 | #60 | Exceptional 15.0% |
| Immigrants | Poland | 99.1 /100 | #61 | Exceptional 15.1% |
| Immigrants | Eastern Europe | 99.1 /100 | #62 | Exceptional 15.1% |
| Immigrants | Europe | 99.1 /100 | #63 | Exceptional 15.1% |
| Immigrants | Romania | 99.1 /100 | #64 | Exceptional 15.2% |
| Immigrants | Fiji | 99.0 /100 | #65 | Exceptional 15.2% |
| Immigrants | Scotland | 99.0 /100 | #66 | Exceptional 15.2% |
| Greeks | 99.0 /100 | #67 | Exceptional 15.2% |