English vs Immigrants from Russia Kindergarten
COMPARE
English
Immigrants from Russia
Kindergarten
Kindergarten Comparison
English
Immigrants from Russia
98.7%
KINDERGARTEN
100.0/ 100
METRIC RATING
14th/ 347
METRIC RANK
98.0%
KINDERGARTEN
59.0/ 100
METRIC RATING
160th/ 347
METRIC RANK
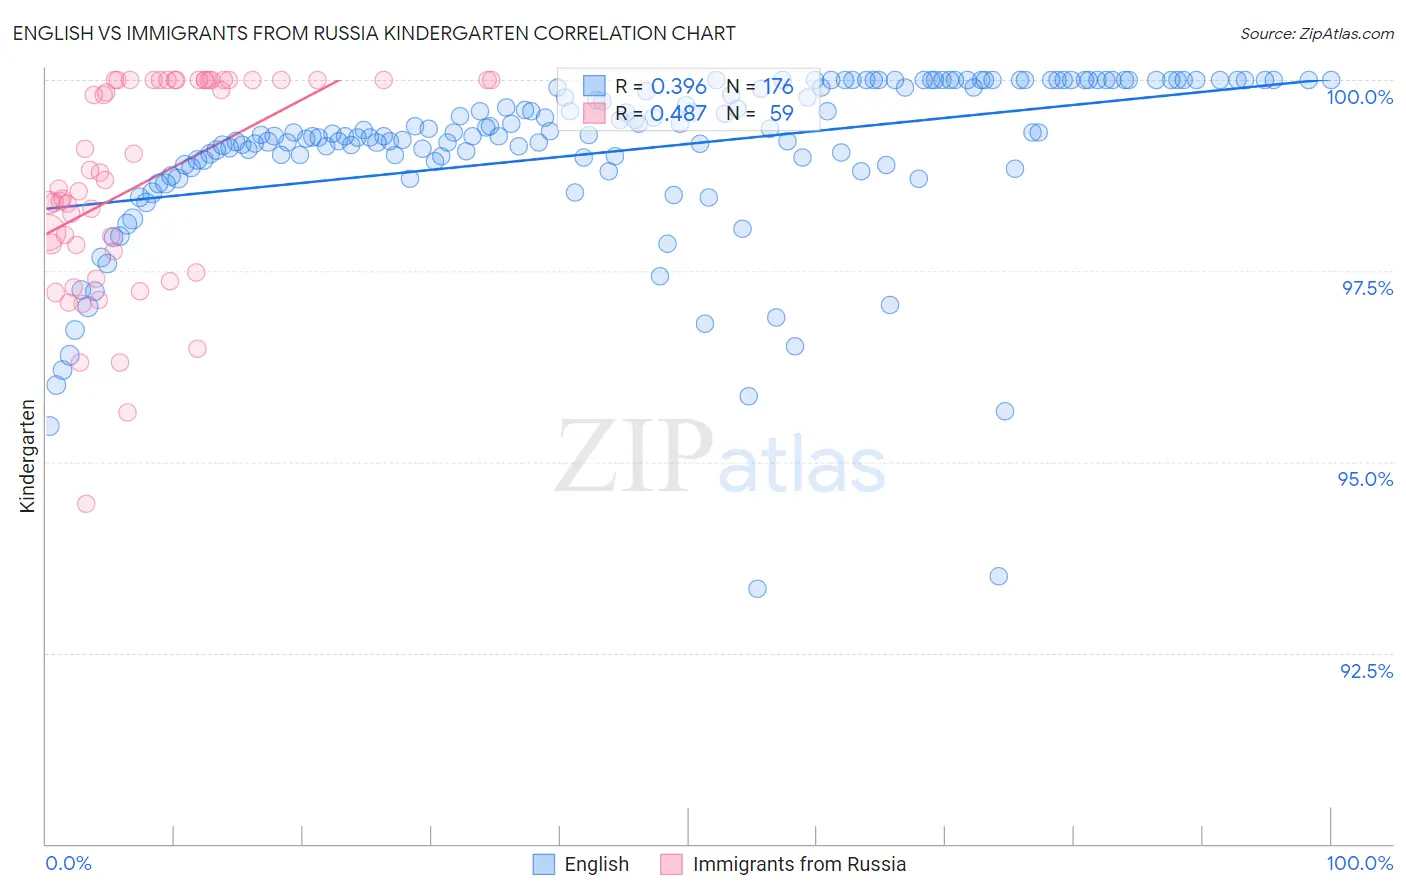
English vs Immigrants from Russia Kindergarten Correlation Chart
The statistical analysis conducted on geographies consisting of 579,981,412 people shows a mild positive correlation between the proportion of English and percentage of population with at least kindergarten education in the United States with a correlation coefficient (R) of 0.396 and weighted average of 98.7%. Similarly, the statistical analysis conducted on geographies consisting of 347,948,494 people shows a moderate positive correlation between the proportion of Immigrants from Russia and percentage of population with at least kindergarten education in the United States with a correlation coefficient (R) of 0.487 and weighted average of 98.0%, a difference of 0.70%.
Kindergarten Correlation Summary
| Measurement | English | Immigrants from Russia |
| Minimum | 93.3% | 94.5% |
| Maximum | 100.0% | 100.0% |
| Range | 6.7% | 5.5% |
| Mean | 99.1% | 98.7% |
| Median | 99.3% | 98.7% |
| Interquartile 25% (IQ1) | 98.9% | 97.8% |
| Interquartile 75% (IQ3) | 100.0% | 100.0% |
| Interquartile Range (IQR) | 1.1% | 2.2% |
| Standard Deviation (Sample) | 1.1% | 1.4% |
| Standard Deviation (Population) | 1.1% | 1.4% |
Similar Demographics by Kindergarten
Demographics Similar to English by Kindergarten
In terms of kindergarten, the demographic groups most similar to English are Carpatho Rusyn (98.7%, a difference of 0.0%), Slovene (98.7%, a difference of 0.010%), Swedish (98.7%, a difference of 0.010%), Aleut (98.6%, a difference of 0.030%), and Scottish (98.6%, a difference of 0.030%).
| Demographics | Rating | Rank | Kindergarten |
| Alaska Natives | 100.0 /100 | #7 | Exceptional 98.7% |
| Norwegians | 100.0 /100 | #8 | Exceptional 98.7% |
| Tlingit-Haida | 100.0 /100 | #9 | Exceptional 98.7% |
| Slovaks | 100.0 /100 | #10 | Exceptional 98.7% |
| Germans | 100.0 /100 | #11 | Exceptional 98.7% |
| Slovenes | 100.0 /100 | #12 | Exceptional 98.7% |
| Carpatho Rusyns | 100.0 /100 | #13 | Exceptional 98.7% |
| English | 100.0 /100 | #14 | Exceptional 98.7% |
| Swedes | 100.0 /100 | #15 | Exceptional 98.7% |
| Aleuts | 100.0 /100 | #16 | Exceptional 98.6% |
| Scottish | 100.0 /100 | #17 | Exceptional 98.6% |
| Dutch | 100.0 /100 | #18 | Exceptional 98.6% |
| Irish | 100.0 /100 | #19 | Exceptional 98.6% |
| Pennsylvania Germans | 100.0 /100 | #20 | Exceptional 98.6% |
| Lithuanians | 100.0 /100 | #21 | Exceptional 98.6% |
Demographics Similar to Immigrants from Russia by Kindergarten
In terms of kindergarten, the demographic groups most similar to Immigrants from Russia are Immigrants from Eastern Europe (98.0%, a difference of 0.0%), Immigrants from Italy (98.0%, a difference of 0.0%), Spanish American (98.0%, a difference of 0.0%), Immigrants from Micronesia (98.0%, a difference of 0.0%), and Ugandan (98.0%, a difference of 0.010%).
| Demographics | Rating | Rank | Kindergarten |
| Immigrants | Moldova | 69.1 /100 | #153 | Good 98.0% |
| Immigrants | Iran | 68.8 /100 | #154 | Good 98.0% |
| Comanche | 68.3 /100 | #155 | Good 98.0% |
| Immigrants | South Central Asia | 66.6 /100 | #156 | Good 98.0% |
| Immigrants | North Macedonia | 66.4 /100 | #157 | Good 98.0% |
| Venezuelans | 64.7 /100 | #158 | Good 98.0% |
| French American Indians | 63.7 /100 | #159 | Good 98.0% |
| Immigrants | Russia | 59.0 /100 | #160 | Average 98.0% |
| Immigrants | Eastern Europe | 59.0 /100 | #161 | Average 98.0% |
| Immigrants | Italy | 58.9 /100 | #162 | Average 98.0% |
| Spanish Americans | 57.8 /100 | #163 | Average 98.0% |
| Immigrants | Micronesia | 57.7 /100 | #164 | Average 98.0% |
| Ugandans | 56.9 /100 | #165 | Average 98.0% |
| Chileans | 56.3 /100 | #166 | Average 98.0% |
| Immigrants | Spain | 54.6 /100 | #167 | Average 98.0% |