Dominican vs Immigrants from Middle Africa Child Poverty Under the Age of 16
COMPARE
Dominican
Immigrants from Middle Africa
Child Poverty Under the Age of 16
Child Poverty Under the Age of 16 Comparison
Dominicans
Immigrants from Middle Africa
23.8%
CHILD POVERTY UNDER THE AGE OF 16
0.0/ 100
METRIC RATING
329th/ 347
METRIC RANK
19.0%
CHILD POVERTY UNDER THE AGE OF 16
0.3/ 100
METRIC RATING
250th/ 347
METRIC RANK
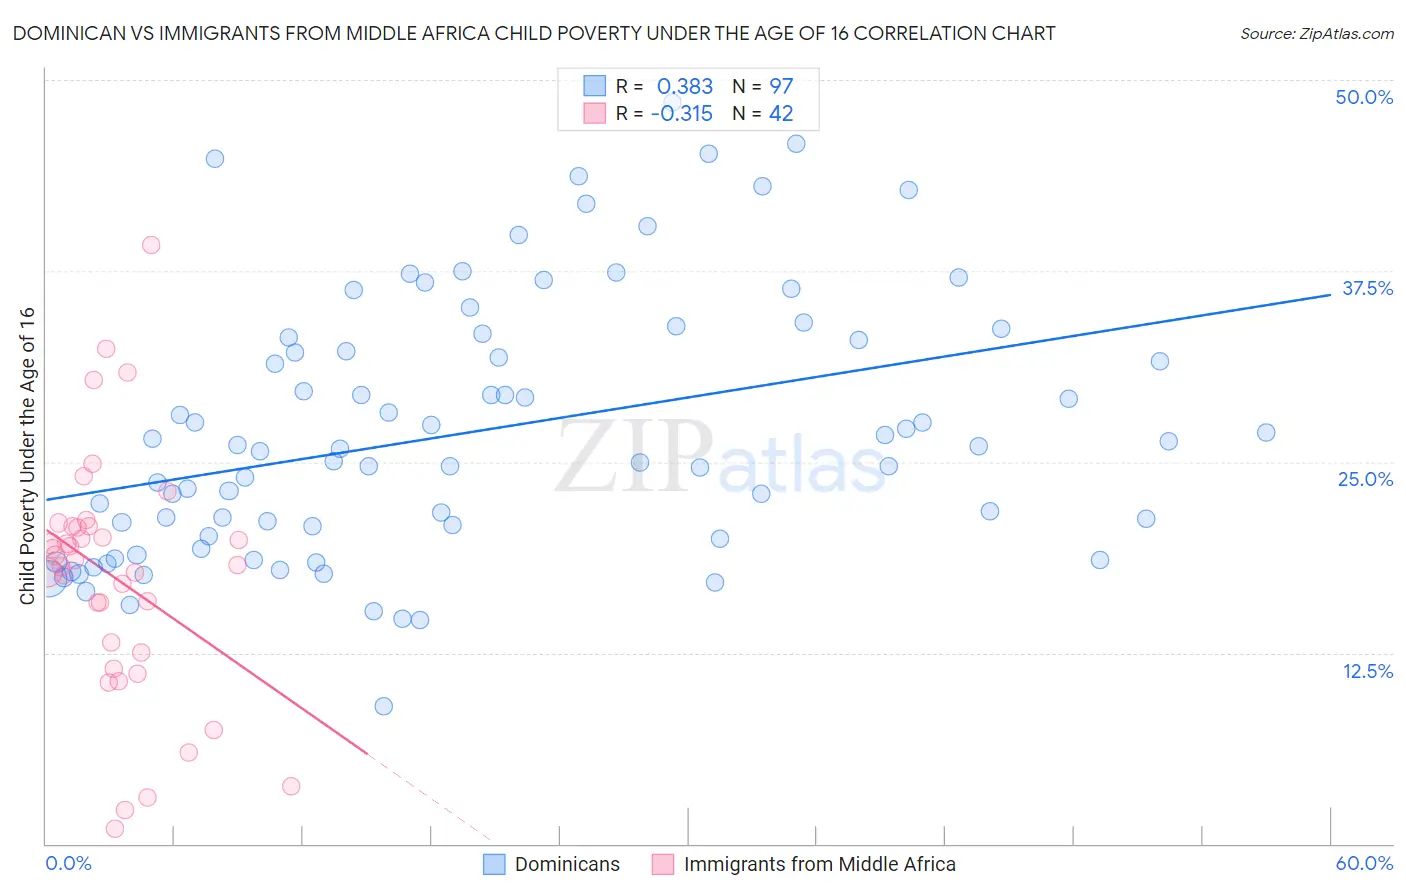
Dominican vs Immigrants from Middle Africa Child Poverty Under the Age of 16 Correlation Chart
The statistical analysis conducted on geographies consisting of 352,075,478 people shows a mild positive correlation between the proportion of Dominicans and poverty level among children under the age of 16 in the United States with a correlation coefficient (R) of 0.383 and weighted average of 23.8%. Similarly, the statistical analysis conducted on geographies consisting of 202,234,084 people shows a mild negative correlation between the proportion of Immigrants from Middle Africa and poverty level among children under the age of 16 in the United States with a correlation coefficient (R) of -0.315 and weighted average of 19.0%, a difference of 24.9%.
Child Poverty Under the Age of 16 Correlation Summary
| Measurement | Dominican | Immigrants from Middle Africa |
| Minimum | 9.0% | 0.99% |
| Maximum | 48.5% | 39.2% |
| Range | 39.5% | 38.2% |
| Mean | 27.0% | 17.4% |
| Median | 25.9% | 18.4% |
| Interquartile 25% (IQ1) | 20.1% | 12.5% |
| Interquartile 75% (IQ3) | 33.1% | 20.8% |
| Interquartile Range (IQR) | 13.0% | 8.3% |
| Standard Deviation (Sample) | 8.5% | 8.0% |
| Standard Deviation (Population) | 8.5% | 7.9% |
Similar Demographics by Child Poverty Under the Age of 16
Demographics Similar to Dominicans by Child Poverty Under the Age of 16
In terms of child poverty under the age of 16, the demographic groups most similar to Dominicans are Native/Alaskan (23.8%, a difference of 0.090%), Apache (23.8%, a difference of 0.31%), Pueblo (23.9%, a difference of 0.69%), Immigrants from Dominican Republic (24.0%, a difference of 0.87%), and Black/African American (24.4%, a difference of 2.9%).
| Demographics | Rating | Rank | Child Poverty Under the Age of 16 |
| Hondurans | 0.0 /100 | #322 | Tragic 22.2% |
| Paiute | 0.0 /100 | #323 | Tragic 22.4% |
| Central American Indians | 0.0 /100 | #324 | Tragic 22.5% |
| Immigrants | Congo | 0.0 /100 | #325 | Tragic 22.5% |
| Immigrants | Honduras | 0.0 /100 | #326 | Tragic 22.7% |
| Menominee | 0.0 /100 | #327 | Tragic 23.0% |
| Colville | 0.0 /100 | #328 | Tragic 23.0% |
| Dominicans | 0.0 /100 | #329 | Tragic 23.8% |
| Natives/Alaskans | 0.0 /100 | #330 | Tragic 23.8% |
| Apache | 0.0 /100 | #331 | Tragic 23.8% |
| Pueblo | 0.0 /100 | #332 | Tragic 23.9% |
| Immigrants | Dominican Republic | 0.0 /100 | #333 | Tragic 24.0% |
| Blacks/African Americans | 0.0 /100 | #334 | Tragic 24.4% |
| Houma | 0.0 /100 | #335 | Tragic 24.9% |
| Yup'ik | 0.0 /100 | #336 | Tragic 25.1% |
Demographics Similar to Immigrants from Middle Africa by Child Poverty Under the Age of 16
In terms of child poverty under the age of 16, the demographic groups most similar to Immigrants from Middle Africa are Immigrants from Ghana (19.1%, a difference of 0.16%), Potawatomi (19.0%, a difference of 0.20%), Immigrants from Trinidad and Tobago (19.1%, a difference of 0.23%), Ecuadorian (19.0%, a difference of 0.39%), and Salvadoran (19.1%, a difference of 0.42%).
| Demographics | Rating | Rank | Child Poverty Under the Age of 16 |
| Immigrants | Cuba | 0.6 /100 | #243 | Tragic 18.7% |
| Cape Verdeans | 0.6 /100 | #244 | Tragic 18.7% |
| Shoshone | 0.5 /100 | #245 | Tragic 18.8% |
| Immigrants | Nicaragua | 0.4 /100 | #246 | Tragic 18.8% |
| French American Indians | 0.4 /100 | #247 | Tragic 18.9% |
| Ecuadorians | 0.3 /100 | #248 | Tragic 19.0% |
| Potawatomi | 0.3 /100 | #249 | Tragic 19.0% |
| Immigrants | Middle Africa | 0.3 /100 | #250 | Tragic 19.0% |
| Immigrants | Ghana | 0.3 /100 | #251 | Tragic 19.1% |
| Immigrants | Trinidad and Tobago | 0.3 /100 | #252 | Tragic 19.1% |
| Salvadorans | 0.3 /100 | #253 | Tragic 19.1% |
| Immigrants | Western Africa | 0.2 /100 | #254 | Tragic 19.2% |
| Trinidadians and Tobagonians | 0.2 /100 | #255 | Tragic 19.2% |
| Inupiat | 0.2 /100 | #256 | Tragic 19.2% |
| Ottawa | 0.2 /100 | #257 | Tragic 19.2% |