Czech vs Dutch Seniors Poverty Over the Age of 75
COMPARE
Czech
Dutch
Seniors Poverty Over the Age of 75
Seniors Poverty Over the Age of 75 Comparison
Czechs
Dutch
10.5%
SENIORS POVERTY OVER THE AGE OF 75
99.9/ 100
METRIC RATING
20th/ 347
METRIC RANK
10.5%
SENIORS POVERTY OVER THE AGE OF 75
99.9/ 100
METRIC RATING
16th/ 347
METRIC RANK
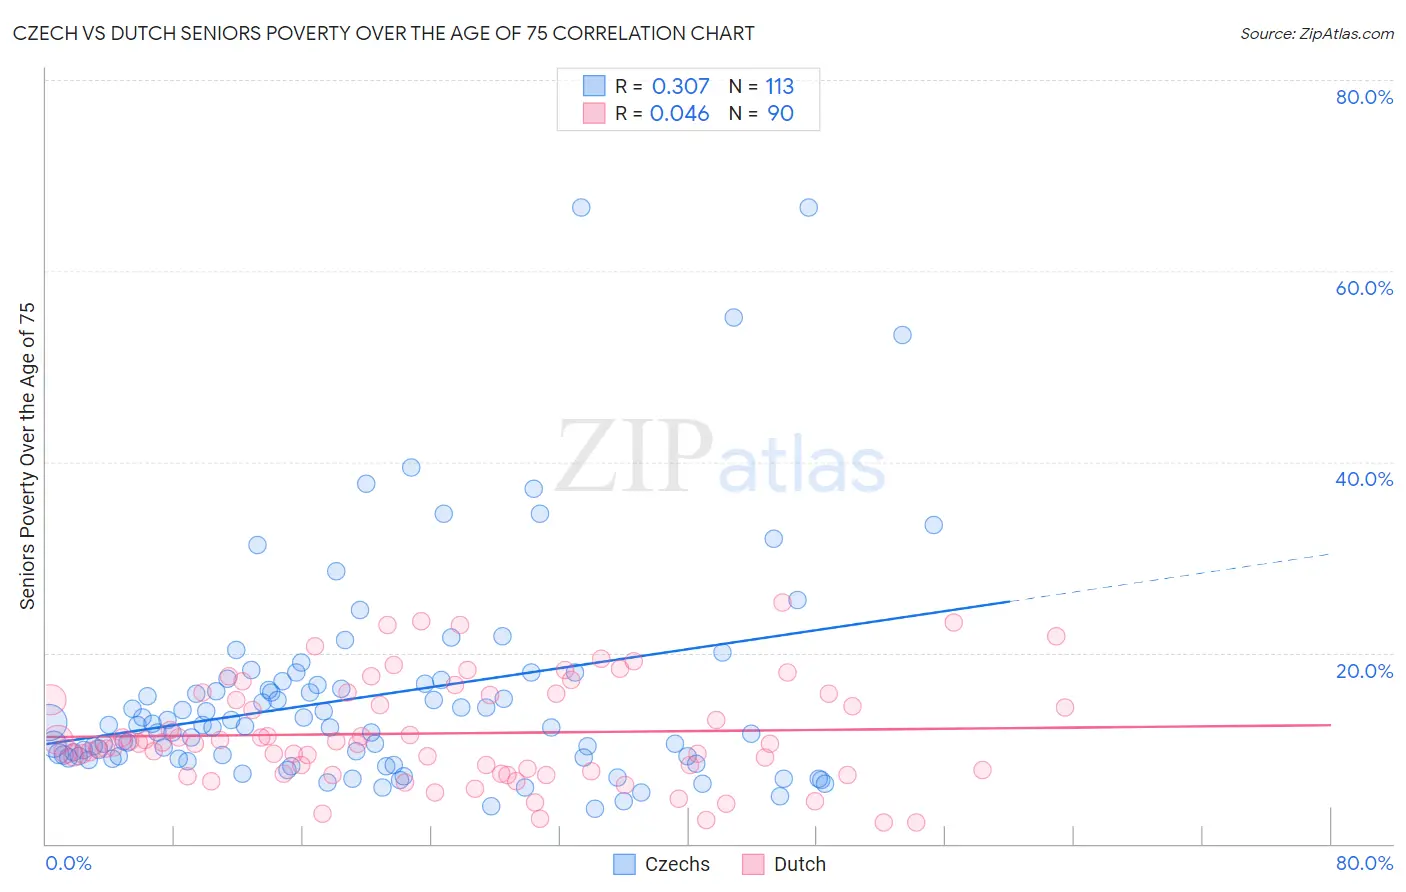
Czech vs Dutch Seniors Poverty Over the Age of 75 Correlation Chart
The statistical analysis conducted on geographies consisting of 475,172,256 people shows a mild positive correlation between the proportion of Czechs and poverty level among seniors over the age of 75 in the United States with a correlation coefficient (R) of 0.307 and weighted average of 10.5%. Similarly, the statistical analysis conducted on geographies consisting of 539,215,088 people shows no correlation between the proportion of Dutch and poverty level among seniors over the age of 75 in the United States with a correlation coefficient (R) of 0.046 and weighted average of 10.5%, a difference of 0.26%.
Seniors Poverty Over the Age of 75 Correlation Summary
| Measurement | Czech | Dutch |
| Minimum | 3.7% | 2.2% |
| Maximum | 66.7% | 25.2% |
| Range | 63.0% | 23.0% |
| Mean | 15.5% | 11.6% |
| Median | 12.3% | 10.5% |
| Interquartile 25% (IQ1) | 9.0% | 7.6% |
| Interquartile 75% (IQ3) | 16.9% | 15.7% |
| Interquartile Range (IQR) | 7.9% | 8.1% |
| Standard Deviation (Sample) | 11.5% | 5.4% |
| Standard Deviation (Population) | 11.5% | 5.4% |
Demographics Similar to Czechs and Dutch by Seniors Poverty Over the Age of 75
In terms of seniors poverty over the age of 75, the demographic groups most similar to Czechs are Immigrants from Scotland (10.5%, a difference of 0.020%), Slovene (10.6%, a difference of 0.040%), Welsh (10.5%, a difference of 0.050%), Slovak (10.5%, a difference of 0.060%), and Bhutanese (10.6%, a difference of 0.30%). Similarly, the demographic groups most similar to Dutch are Scottish (10.5%, a difference of 0.12%), European (10.5%, a difference of 0.12%), Slovak (10.5%, a difference of 0.21%), Welsh (10.5%, a difference of 0.21%), and Immigrants from Scotland (10.5%, a difference of 0.25%).
| Demographics | Rating | Rank | Seniors Poverty Over the Age of 75 |
| Germans | 99.9 /100 | #8 | Exceptional 10.4% |
| English | 99.9 /100 | #9 | Exceptional 10.4% |
| Scandinavians | 99.9 /100 | #10 | Exceptional 10.4% |
| Immigrants | India | 99.9 /100 | #11 | Exceptional 10.4% |
| Tongans | 99.9 /100 | #12 | Exceptional 10.5% |
| Croatians | 99.9 /100 | #13 | Exceptional 10.5% |
| Scottish | 99.9 /100 | #14 | Exceptional 10.5% |
| Europeans | 99.9 /100 | #15 | Exceptional 10.5% |
| Dutch | 99.9 /100 | #16 | Exceptional 10.5% |
| Slovaks | 99.9 /100 | #17 | Exceptional 10.5% |
| Welsh | 99.9 /100 | #18 | Exceptional 10.5% |
| Immigrants | Scotland | 99.9 /100 | #19 | Exceptional 10.5% |
| Czechs | 99.9 /100 | #20 | Exceptional 10.5% |
| Slovenes | 99.9 /100 | #21 | Exceptional 10.6% |
| Bhutanese | 99.8 /100 | #22 | Exceptional 10.6% |
| Lithuanians | 99.8 /100 | #23 | Exceptional 10.6% |
| Poles | 99.8 /100 | #24 | Exceptional 10.6% |
| Menominee | 99.8 /100 | #25 | Exceptional 10.6% |
| Bulgarians | 99.8 /100 | #26 | Exceptional 10.7% |
| Northern Europeans | 99.8 /100 | #27 | Exceptional 10.7% |
| Irish | 99.8 /100 | #28 | Exceptional 10.7% |