Cree vs Canadian Female Poverty Among 18-24 Year Olds
COMPARE
Cree
Canadian
Female Poverty Among 18-24 Year Olds
Female Poverty Among 18-24 Year Olds Comparison
Cree
Canadians
23.4%
FEMALE POVERTY AMONG 18-24 YEAR OLDS
0.0/ 100
METRIC RATING
307th/ 347
METRIC RANK
19.7%
FEMALE POVERTY AMONG 18-24 YEAR OLDS
83.8/ 100
METRIC RATING
145th/ 347
METRIC RANK
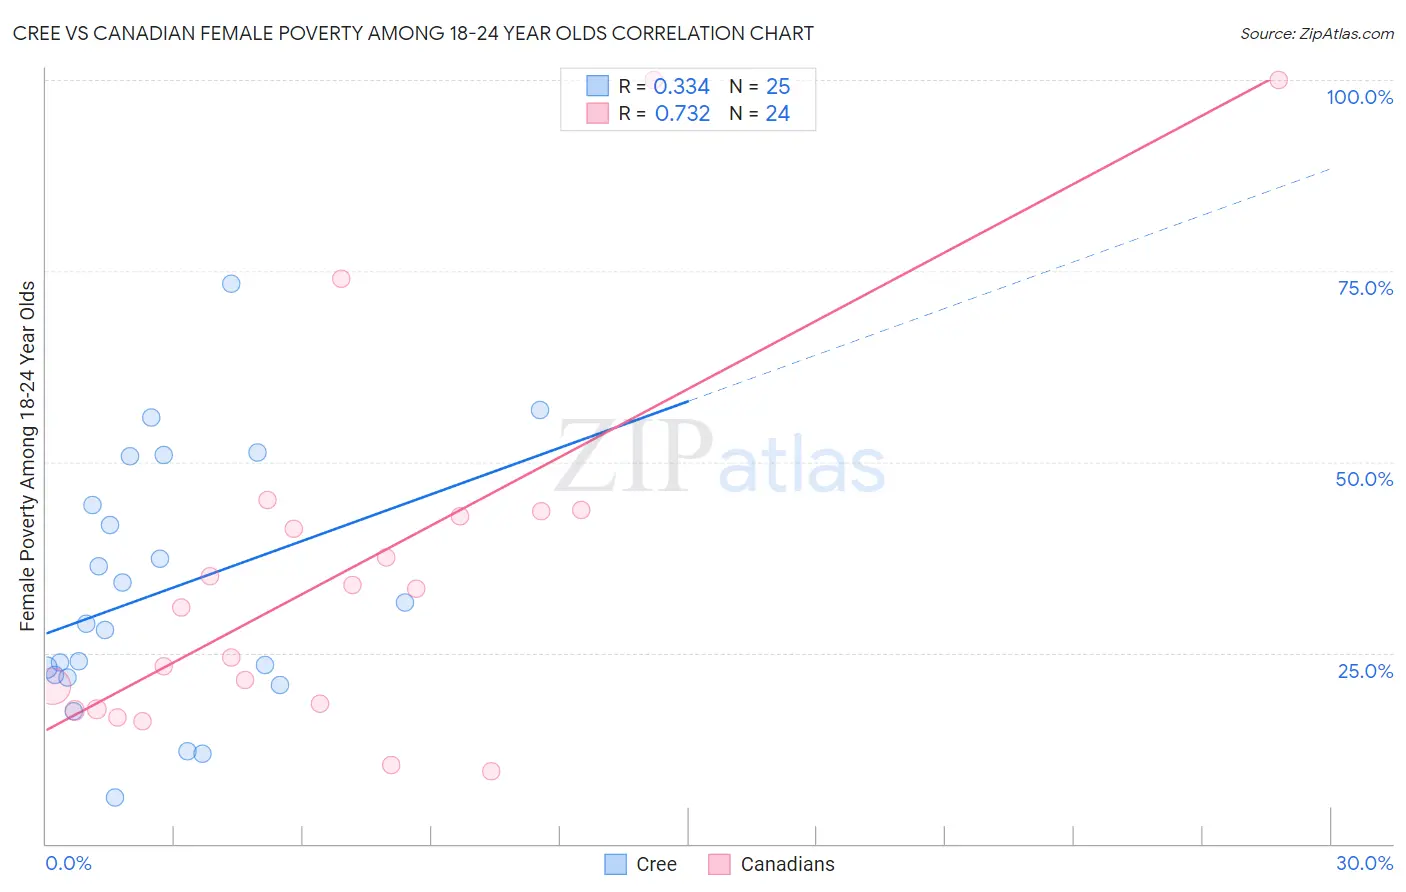
Cree vs Canadian Female Poverty Among 18-24 Year Olds Correlation Chart
The statistical analysis conducted on geographies consisting of 75,651,650 people shows a mild positive correlation between the proportion of Cree and poverty level among females between the ages 18 and 24 in the United States with a correlation coefficient (R) of 0.334 and weighted average of 23.4%. Similarly, the statistical analysis conducted on geographies consisting of 422,696,496 people shows a strong positive correlation between the proportion of Canadians and poverty level among females between the ages 18 and 24 in the United States with a correlation coefficient (R) of 0.732 and weighted average of 19.7%, a difference of 18.9%.
Female Poverty Among 18-24 Year Olds Correlation Summary
| Measurement | Cree | Canadian |
| Minimum | 6.0% | 9.5% |
| Maximum | 73.3% | 100.0% |
| Range | 67.3% | 90.5% |
| Mean | 33.1% | 35.7% |
| Median | 28.9% | 32.2% |
| Interquartile 25% (IQ1) | 21.9% | 17.9% |
| Interquartile 75% (IQ3) | 47.5% | 43.2% |
| Interquartile Range (IQR) | 25.6% | 25.3% |
| Standard Deviation (Sample) | 16.6% | 24.5% |
| Standard Deviation (Population) | 16.2% | 24.0% |
Similar Demographics by Female Poverty Among 18-24 Year Olds
Demographics Similar to Cree by Female Poverty Among 18-24 Year Olds
In terms of female poverty among 18-24 year olds, the demographic groups most similar to Cree are Immigrants from Sudan (23.5%, a difference of 0.35%), Paiute (23.3%, a difference of 0.59%), Blackfeet (23.6%, a difference of 0.80%), Comanche (23.6%, a difference of 0.85%), and Potawatomi (23.7%, a difference of 1.1%).
| Demographics | Rating | Rank | Female Poverty Among 18-24 Year Olds |
| Africans | 0.0 /100 | #300 | Tragic 22.8% |
| Seminole | 0.0 /100 | #301 | Tragic 22.9% |
| Iroquois | 0.0 /100 | #302 | Tragic 22.9% |
| Senegalese | 0.0 /100 | #303 | Tragic 23.0% |
| Sudanese | 0.0 /100 | #304 | Tragic 23.0% |
| Immigrants | Kuwait | 0.0 /100 | #305 | Tragic 23.0% |
| Paiute | 0.0 /100 | #306 | Tragic 23.3% |
| Cree | 0.0 /100 | #307 | Tragic 23.4% |
| Immigrants | Sudan | 0.0 /100 | #308 | Tragic 23.5% |
| Blackfeet | 0.0 /100 | #309 | Tragic 23.6% |
| Comanche | 0.0 /100 | #310 | Tragic 23.6% |
| Potawatomi | 0.0 /100 | #311 | Tragic 23.7% |
| Yuman | 0.0 /100 | #312 | Tragic 24.0% |
| Creek | 0.0 /100 | #313 | Tragic 24.2% |
| Choctaw | 0.0 /100 | #314 | Tragic 24.3% |
Demographics Similar to Canadians by Female Poverty Among 18-24 Year Olds
In terms of female poverty among 18-24 year olds, the demographic groups most similar to Canadians are Immigrants from Bosnia and Herzegovina (19.7%, a difference of 0.020%), Immigrants from Northern Africa (19.7%, a difference of 0.030%), Slavic (19.7%, a difference of 0.060%), Immigrants from Austria (19.7%, a difference of 0.060%), and Panamanian (19.7%, a difference of 0.070%).
| Demographics | Rating | Rank | Female Poverty Among 18-24 Year Olds |
| Immigrants | Morocco | 89.9 /100 | #138 | Excellent 19.6% |
| Indians (Asian) | 88.3 /100 | #139 | Excellent 19.6% |
| Immigrants | Trinidad and Tobago | 85.6 /100 | #140 | Excellent 19.7% |
| Pennsylvania Germans | 85.5 /100 | #141 | Excellent 19.7% |
| Panamanians | 84.6 /100 | #142 | Excellent 19.7% |
| Slavs | 84.4 /100 | #143 | Excellent 19.7% |
| Immigrants | Northern Africa | 84.1 /100 | #144 | Excellent 19.7% |
| Canadians | 83.8 /100 | #145 | Excellent 19.7% |
| Immigrants | Bosnia and Herzegovina | 83.6 /100 | #146 | Excellent 19.7% |
| Immigrants | Austria | 83.1 /100 | #147 | Excellent 19.7% |
| Immigrants | Latin America | 81.3 /100 | #148 | Excellent 19.7% |
| Immigrants | Oceania | 81.2 /100 | #149 | Excellent 19.7% |
| Syrians | 80.2 /100 | #150 | Excellent 19.8% |
| Immigrants | Eastern Asia | 79.7 /100 | #151 | Good 19.8% |
| Yugoslavians | 79.0 /100 | #152 | Good 19.8% |