Colombian vs Immigrants from Syria Child Poverty Among Boys Under 16
COMPARE
Colombian
Immigrants from Syria
Child Poverty Among Boys Under 16
Child Poverty Among Boys Under 16 Comparison
Colombians
Immigrants from Syria
16.1%
CHILD POVERTY AMONG BOYS UNDER 16
65.2/ 100
METRIC RATING
165th/ 347
METRIC RANK
16.5%
CHILD POVERTY AMONG BOYS UNDER 16
49.0/ 100
METRIC RATING
175th/ 347
METRIC RANK
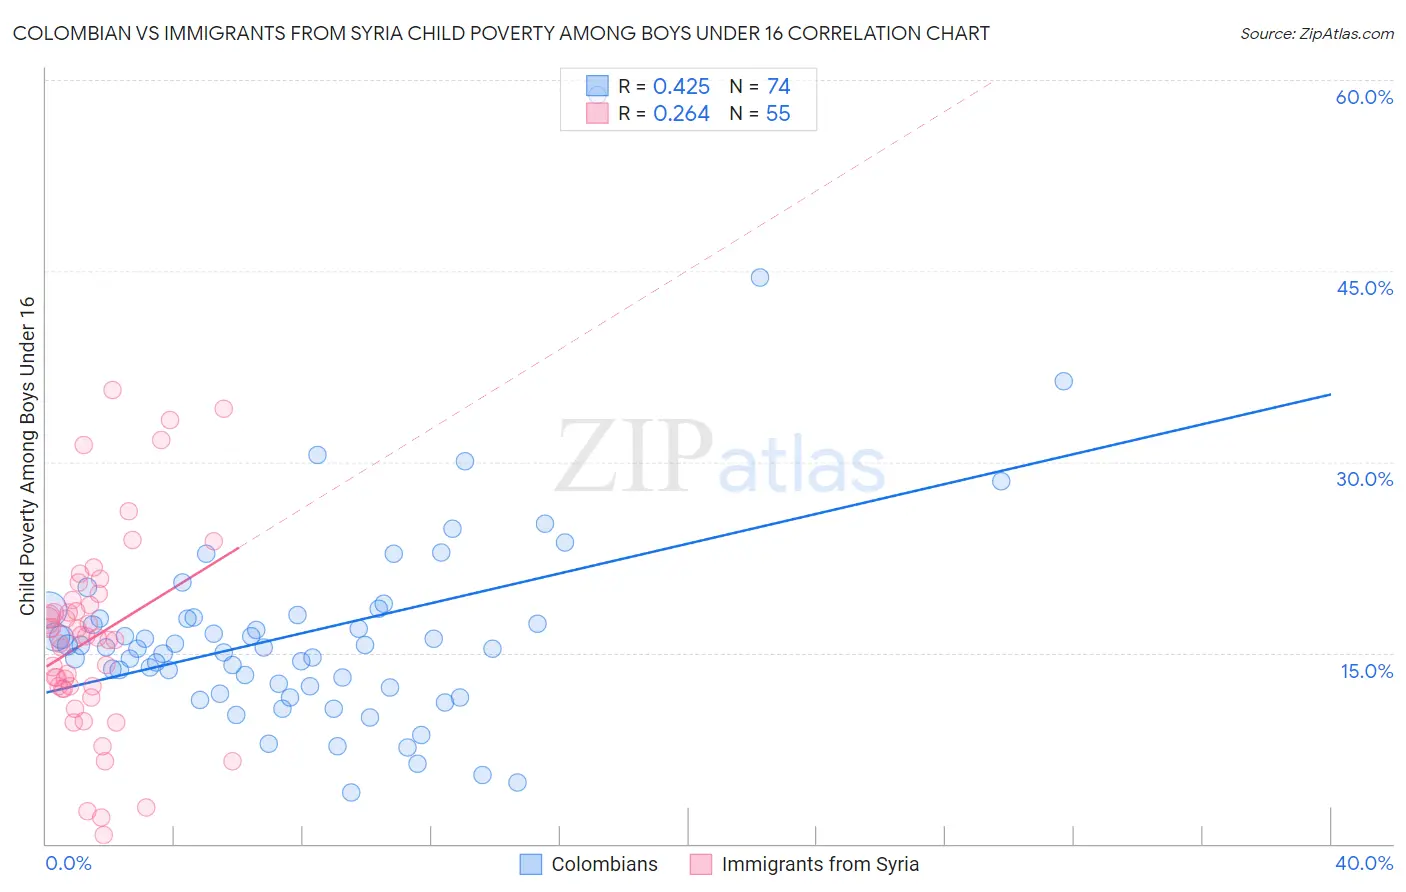
Colombian vs Immigrants from Syria Child Poverty Among Boys Under 16 Correlation Chart
The statistical analysis conducted on geographies consisting of 412,508,797 people shows a moderate positive correlation between the proportion of Colombians and poverty level among boys under the age of 16 in the United States with a correlation coefficient (R) of 0.425 and weighted average of 16.1%. Similarly, the statistical analysis conducted on geographies consisting of 173,156,396 people shows a weak positive correlation between the proportion of Immigrants from Syria and poverty level among boys under the age of 16 in the United States with a correlation coefficient (R) of 0.264 and weighted average of 16.5%, a difference of 1.9%.
Child Poverty Among Boys Under 16 Correlation Summary
| Measurement | Colombian | Immigrants from Syria |
| Minimum | 4.0% | 0.70% |
| Maximum | 58.8% | 35.6% |
| Range | 54.7% | 34.9% |
| Mean | 16.6% | 16.2% |
| Median | 15.4% | 16.2% |
| Interquartile 25% (IQ1) | 12.4% | 12.2% |
| Interquartile 75% (IQ3) | 17.7% | 19.2% |
| Interquartile Range (IQR) | 5.3% | 7.0% |
| Standard Deviation (Sample) | 8.3% | 7.7% |
| Standard Deviation (Population) | 8.3% | 7.6% |
Demographics Similar to Colombians and Immigrants from Syria by Child Poverty Among Boys Under 16
In terms of child poverty among boys under 16, the demographic groups most similar to Colombians are Immigrants from Germany (16.2%, a difference of 0.20%), Immigrants from Albania (16.1%, a difference of 0.35%), Costa Rican (16.1%, a difference of 0.38%), Guamanian/Chamorro (16.1%, a difference of 0.58%), and Immigrants from Oceania (16.0%, a difference of 0.81%). Similarly, the demographic groups most similar to Immigrants from Syria are White/Caucasian (16.5%, a difference of 0.090%), Uruguayan (16.4%, a difference of 0.11%), Ethiopian (16.5%, a difference of 0.14%), Tsimshian (16.4%, a difference of 0.16%), and Scotch-Irish (16.5%, a difference of 0.17%).
| Demographics | Rating | Rank | Child Poverty Among Boys Under 16 |
| Immigrants | Northern Africa | 71.3 /100 | #160 | Good 16.0% |
| Immigrants | Oceania | 71.3 /100 | #161 | Good 16.0% |
| Guamanians/Chamorros | 69.6 /100 | #162 | Good 16.1% |
| Costa Ricans | 68.1 /100 | #163 | Good 16.1% |
| Immigrants | Albania | 67.9 /100 | #164 | Good 16.1% |
| Colombians | 65.2 /100 | #165 | Good 16.1% |
| Immigrants | Germany | 63.6 /100 | #166 | Good 16.2% |
| Afghans | 55.4 /100 | #167 | Average 16.3% |
| South Americans | 55.3 /100 | #168 | Average 16.3% |
| Immigrants | Saudi Arabia | 53.6 /100 | #169 | Average 16.4% |
| Immigrants | Bosnia and Herzegovina | 51.7 /100 | #170 | Average 16.4% |
| Immigrants | Ethiopia | 51.3 /100 | #171 | Average 16.4% |
| Immigrants | Colombia | 50.8 /100 | #172 | Average 16.4% |
| Tsimshian | 50.5 /100 | #173 | Average 16.4% |
| Uruguayans | 50.0 /100 | #174 | Average 16.4% |
| Immigrants | Syria | 49.0 /100 | #175 | Average 16.5% |
| Whites/Caucasians | 48.2 /100 | #176 | Average 16.5% |
| Ethiopians | 47.8 /100 | #177 | Average 16.5% |
| Scotch-Irish | 47.5 /100 | #178 | Average 16.5% |
| Hungarians | 47.3 /100 | #179 | Average 16.5% |
| Hawaiians | 45.5 /100 | #180 | Average 16.5% |