Cape Verdean vs Slavic Seniors Poverty Over the Age of 75
COMPARE
Cape Verdean
Slavic
Seniors Poverty Over the Age of 75
Seniors Poverty Over the Age of 75 Comparison
Cape Verdeans
Slavs
16.8%
SENIORS POVERTY OVER THE AGE OF 75
0.0/ 100
METRIC RATING
328th/ 347
METRIC RANK
11.2%
SENIORS POVERTY OVER THE AGE OF 75
98.1/ 100
METRIC RATING
56th/ 347
METRIC RANK
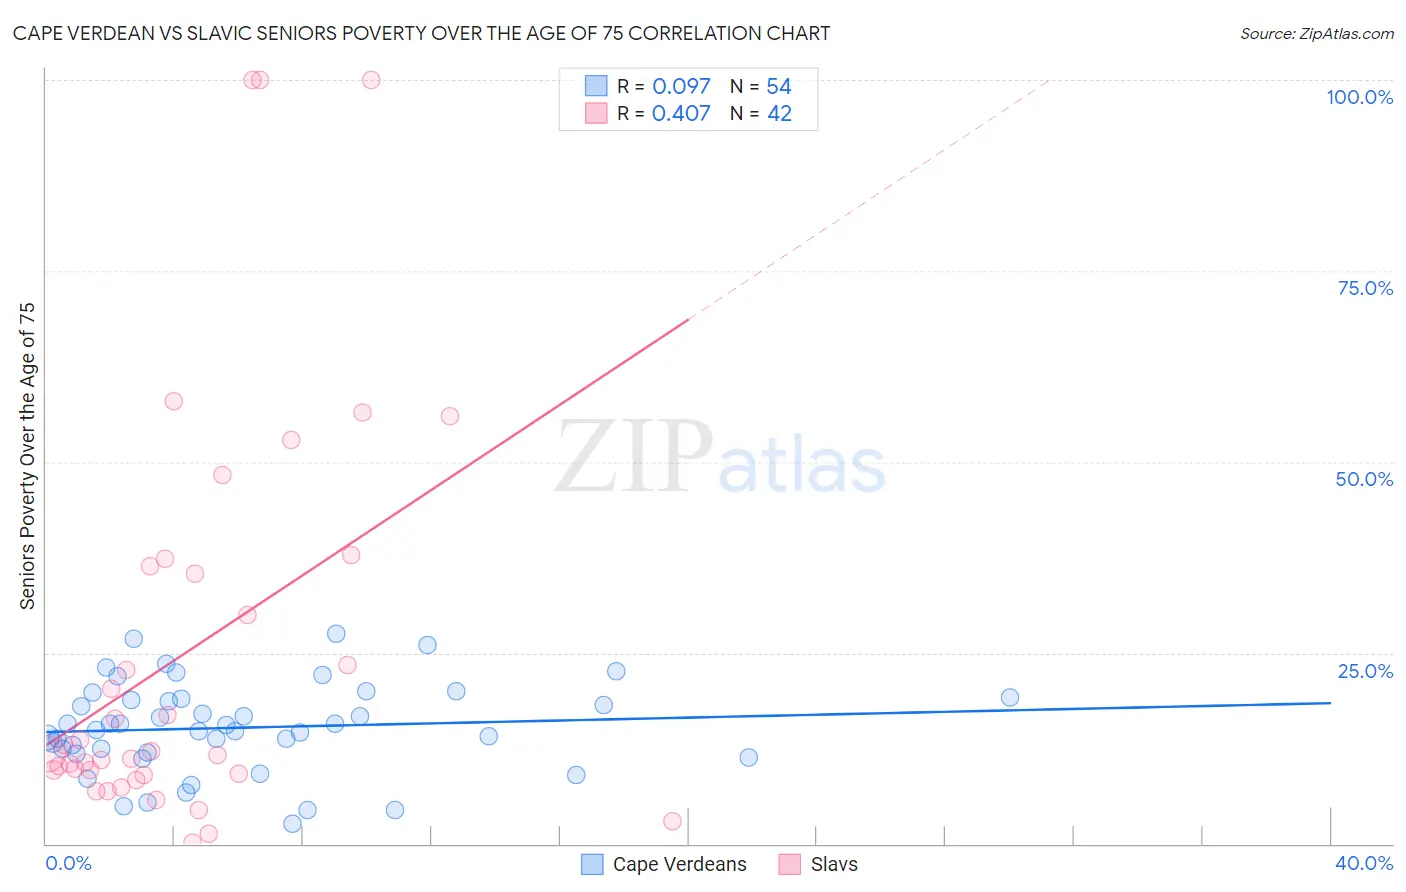
Cape Verdean vs Slavic Seniors Poverty Over the Age of 75 Correlation Chart
The statistical analysis conducted on geographies consisting of 107,206,089 people shows a slight positive correlation between the proportion of Cape Verdeans and poverty level among seniors over the age of 75 in the United States with a correlation coefficient (R) of 0.097 and weighted average of 16.8%. Similarly, the statistical analysis conducted on geographies consisting of 268,817,637 people shows a moderate positive correlation between the proportion of Slavs and poverty level among seniors over the age of 75 in the United States with a correlation coefficient (R) of 0.407 and weighted average of 11.2%, a difference of 49.6%.
Seniors Poverty Over the Age of 75 Correlation Summary
| Measurement | Cape Verdean | Slavic |
| Minimum | 2.7% | 0.17% |
| Maximum | 27.5% | 100.0% |
| Range | 24.8% | 99.8% |
| Mean | 15.2% | 25.1% |
| Median | 15.3% | 12.0% |
| Interquartile 25% (IQ1) | 12.0% | 9.1% |
| Interquartile 75% (IQ3) | 19.0% | 36.4% |
| Interquartile Range (IQR) | 7.0% | 27.3% |
| Standard Deviation (Sample) | 5.8% | 26.5% |
| Standard Deviation (Population) | 5.8% | 26.1% |
Similar Demographics by Seniors Poverty Over the Age of 75
Demographics Similar to Cape Verdeans by Seniors Poverty Over the Age of 75
In terms of seniors poverty over the age of 75, the demographic groups most similar to Cape Verdeans are Sioux (16.8%, a difference of 0.030%), Pueblo (16.7%, a difference of 0.24%), Nicaraguan (16.6%, a difference of 0.94%), Immigrants from Uzbekistan (16.5%, a difference of 1.3%), and Central American Indian (16.5%, a difference of 1.4%).
| Demographics | Rating | Rank | Seniors Poverty Over the Age of 75 |
| Immigrants | Haiti | 0.0 /100 | #321 | Tragic 16.5% |
| Immigrants | Barbados | 0.0 /100 | #322 | Tragic 16.5% |
| Central American Indians | 0.0 /100 | #323 | Tragic 16.5% |
| Immigrants | Uzbekistan | 0.0 /100 | #324 | Tragic 16.5% |
| Nicaraguans | 0.0 /100 | #325 | Tragic 16.6% |
| Pueblo | 0.0 /100 | #326 | Tragic 16.7% |
| Sioux | 0.0 /100 | #327 | Tragic 16.8% |
| Cape Verdeans | 0.0 /100 | #328 | Tragic 16.8% |
| Immigrants | Dominica | 0.0 /100 | #329 | Tragic 17.0% |
| British West Indians | 0.0 /100 | #330 | Tragic 17.4% |
| Immigrants | Armenia | 0.0 /100 | #331 | Tragic 17.5% |
| Immigrants | St. Vincent and the Grenadines | 0.0 /100 | #332 | Tragic 17.5% |
| Immigrants | Nicaragua | 0.0 /100 | #333 | Tragic 17.6% |
| Immigrants | Grenada | 0.0 /100 | #334 | Tragic 17.8% |
| Cubans | 0.0 /100 | #335 | Tragic 18.0% |
Demographics Similar to Slavs by Seniors Poverty Over the Age of 75
In terms of seniors poverty over the age of 75, the demographic groups most similar to Slavs are Hungarian (11.2%, a difference of 0.010%), Afghan (11.2%, a difference of 0.090%), Immigrants from Canada (11.2%, a difference of 0.23%), Yugoslavian (11.2%, a difference of 0.27%), and Immigrants from Netherlands (11.2%, a difference of 0.35%).
| Demographics | Rating | Rank | Seniors Poverty Over the Age of 75 |
| Samoans | 98.7 /100 | #49 | Exceptional 11.1% |
| Serbians | 98.6 /100 | #50 | Exceptional 11.1% |
| Immigrants | North Macedonia | 98.6 /100 | #51 | Exceptional 11.1% |
| Zimbabweans | 98.5 /100 | #52 | Exceptional 11.2% |
| Immigrants | England | 98.4 /100 | #53 | Exceptional 11.2% |
| Afghans | 98.2 /100 | #54 | Exceptional 11.2% |
| Hungarians | 98.1 /100 | #55 | Exceptional 11.2% |
| Slavs | 98.1 /100 | #56 | Exceptional 11.2% |
| Immigrants | Canada | 97.9 /100 | #57 | Exceptional 11.2% |
| Yugoslavians | 97.9 /100 | #58 | Exceptional 11.2% |
| Immigrants | Netherlands | 97.8 /100 | #59 | Exceptional 11.2% |
| Eastern Europeans | 97.7 /100 | #60 | Exceptional 11.3% |
| Canadians | 97.7 /100 | #61 | Exceptional 11.3% |
| Immigrants | North America | 97.6 /100 | #62 | Exceptional 11.3% |
| Immigrants | Afghanistan | 97.5 /100 | #63 | Exceptional 11.3% |