Brazilian vs Iroquois Child Poverty Under the Age of 16
COMPARE
Brazilian
Iroquois
Child Poverty Under the Age of 16
Child Poverty Under the Age of 16 Comparison
Brazilians
Iroquois
15.4%
CHILD POVERTY UNDER THE AGE OF 16
82.8/ 100
METRIC RATING
142nd/ 347
METRIC RANK
19.9%
CHILD POVERTY UNDER THE AGE OF 16
0.1/ 100
METRIC RATING
277th/ 347
METRIC RANK
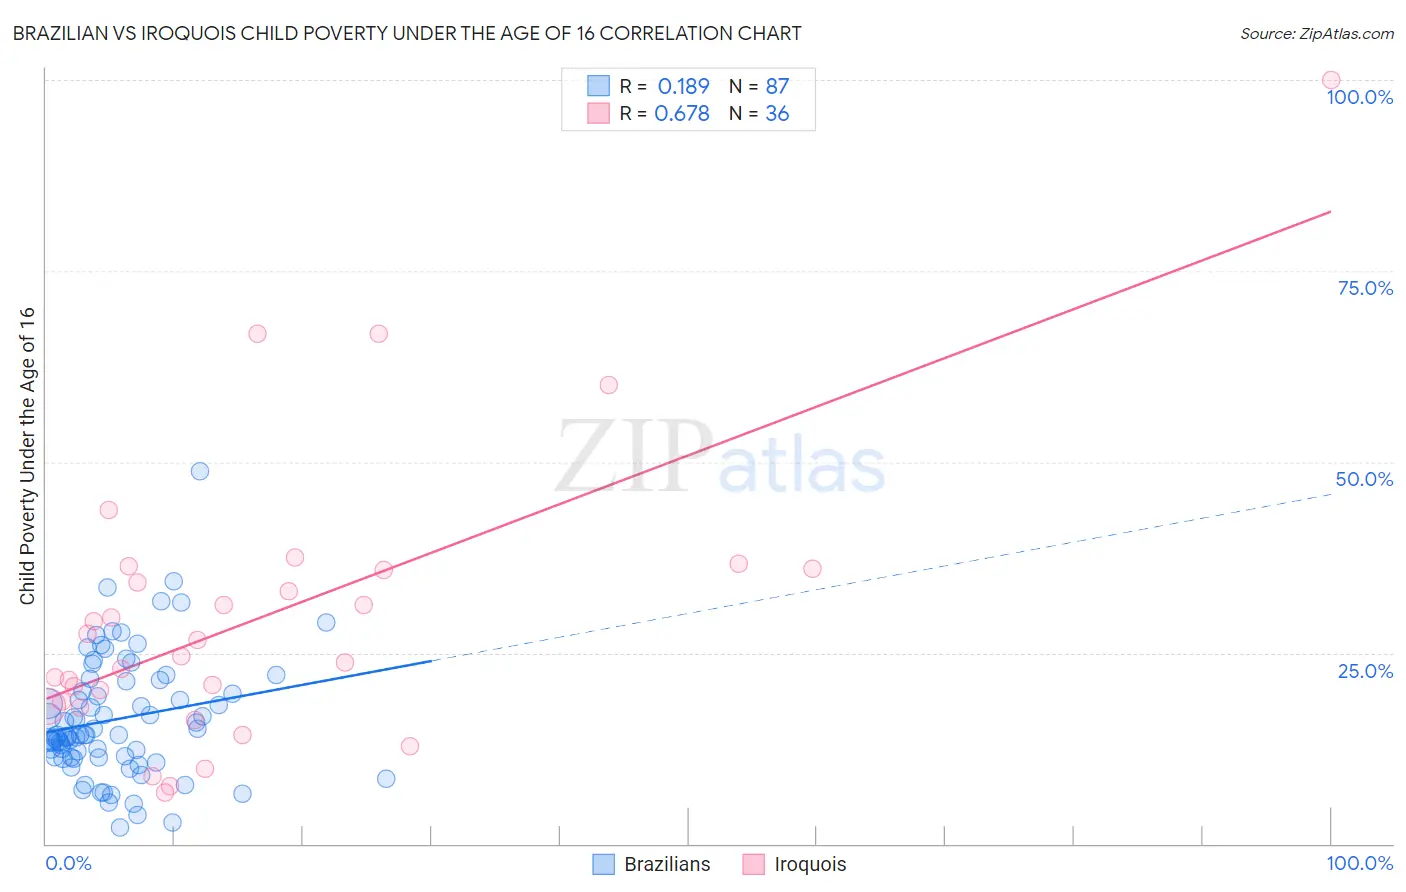
Brazilian vs Iroquois Child Poverty Under the Age of 16 Correlation Chart
The statistical analysis conducted on geographies consisting of 321,388,637 people shows a poor positive correlation between the proportion of Brazilians and poverty level among children under the age of 16 in the United States with a correlation coefficient (R) of 0.189 and weighted average of 15.4%. Similarly, the statistical analysis conducted on geographies consisting of 206,484,755 people shows a significant positive correlation between the proportion of Iroquois and poverty level among children under the age of 16 in the United States with a correlation coefficient (R) of 0.678 and weighted average of 19.9%, a difference of 28.8%.
Child Poverty Under the Age of 16 Correlation Summary
| Measurement | Brazilian | Iroquois |
| Minimum | 2.2% | 6.7% |
| Maximum | 48.8% | 100.0% |
| Range | 46.6% | 93.3% |
| Mean | 16.3% | 29.7% |
| Median | 14.3% | 25.6% |
| Interquartile 25% (IQ1) | 11.3% | 18.3% |
| Interquartile 75% (IQ3) | 21.3% | 36.0% |
| Interquartile Range (IQR) | 10.0% | 17.6% |
| Standard Deviation (Sample) | 8.0% | 18.9% |
| Standard Deviation (Population) | 8.0% | 18.7% |
Similar Demographics by Child Poverty Under the Age of 16
Demographics Similar to Brazilians by Child Poverty Under the Age of 16
In terms of child poverty under the age of 16, the demographic groups most similar to Brazilians are Icelander (15.4%, a difference of 0.070%), Immigrants from Hungary (15.5%, a difference of 0.19%), Immigrants from Peru (15.5%, a difference of 0.24%), Slovak (15.5%, a difference of 0.28%), and Slavic (15.4%, a difference of 0.34%).
| Demographics | Rating | Rank | Child Poverty Under the Age of 16 |
| Albanians | 88.6 /100 | #135 | Excellent 15.2% |
| Immigrants | Spain | 87.3 /100 | #136 | Excellent 15.3% |
| Peruvians | 87.2 /100 | #137 | Excellent 15.3% |
| Welsh | 87.2 /100 | #138 | Excellent 15.3% |
| Immigrants | Vietnam | 87.1 /100 | #139 | Excellent 15.3% |
| New Zealanders | 86.9 /100 | #140 | Excellent 15.3% |
| Slavs | 84.2 /100 | #141 | Excellent 15.4% |
| Brazilians | 82.8 /100 | #142 | Excellent 15.4% |
| Icelanders | 82.5 /100 | #143 | Excellent 15.4% |
| Immigrants | Hungary | 81.9 /100 | #144 | Excellent 15.5% |
| Immigrants | Peru | 81.7 /100 | #145 | Excellent 15.5% |
| Slovaks | 81.4 /100 | #146 | Excellent 15.5% |
| Immigrants | Kuwait | 80.5 /100 | #147 | Excellent 15.5% |
| Puget Sound Salish | 80.3 /100 | #148 | Excellent 15.5% |
| Israelis | 80.1 /100 | #149 | Excellent 15.5% |
Demographics Similar to Iroquois by Child Poverty Under the Age of 16
In terms of child poverty under the age of 16, the demographic groups most similar to Iroquois are Bangladeshi (19.9%, a difference of 0.10%), Subsaharan African (19.9%, a difference of 0.10%), Comanche (19.9%, a difference of 0.11%), Immigrants from Barbados (19.9%, a difference of 0.14%), and Belizean (19.9%, a difference of 0.14%).
| Demographics | Rating | Rank | Child Poverty Under the Age of 16 |
| Spanish American Indians | 0.1 /100 | #270 | Tragic 19.7% |
| Immigrants | Liberia | 0.1 /100 | #271 | Tragic 19.7% |
| Immigrants | Bangladesh | 0.1 /100 | #272 | Tragic 19.8% |
| Immigrants | Jamaica | 0.1 /100 | #273 | Tragic 19.8% |
| Immigrants | Cabo Verde | 0.1 /100 | #274 | Tragic 19.9% |
| Immigrants | Barbados | 0.1 /100 | #275 | Tragic 19.9% |
| Belizeans | 0.1 /100 | #276 | Tragic 19.9% |
| Iroquois | 0.1 /100 | #277 | Tragic 19.9% |
| Bangladeshis | 0.0 /100 | #278 | Tragic 19.9% |
| Sub-Saharan Africans | 0.0 /100 | #279 | Tragic 19.9% |
| Comanche | 0.0 /100 | #280 | Tragic 19.9% |
| Central Americans | 0.0 /100 | #281 | Tragic 20.0% |
| Barbadians | 0.0 /100 | #282 | Tragic 20.0% |
| Immigrants | Zaire | 0.0 /100 | #283 | Tragic 20.1% |
| West Indians | 0.0 /100 | #284 | Tragic 20.1% |