Black/African American vs Taiwanese Child Poverty Under the Age of 5
COMPARE
Black/African American
Taiwanese
Child Poverty Under the Age of 5
Child Poverty Under the Age of 5 Comparison
Blacks/African Americans
Taiwanese
25.7%
CHILD POVERTY UNDER THE AGE OF 5
0.0/ 100
METRIC RATING
334th/ 347
METRIC RANK
14.5%
CHILD POVERTY UNDER THE AGE OF 5
99.8/ 100
METRIC RATING
33rd/ 347
METRIC RANK
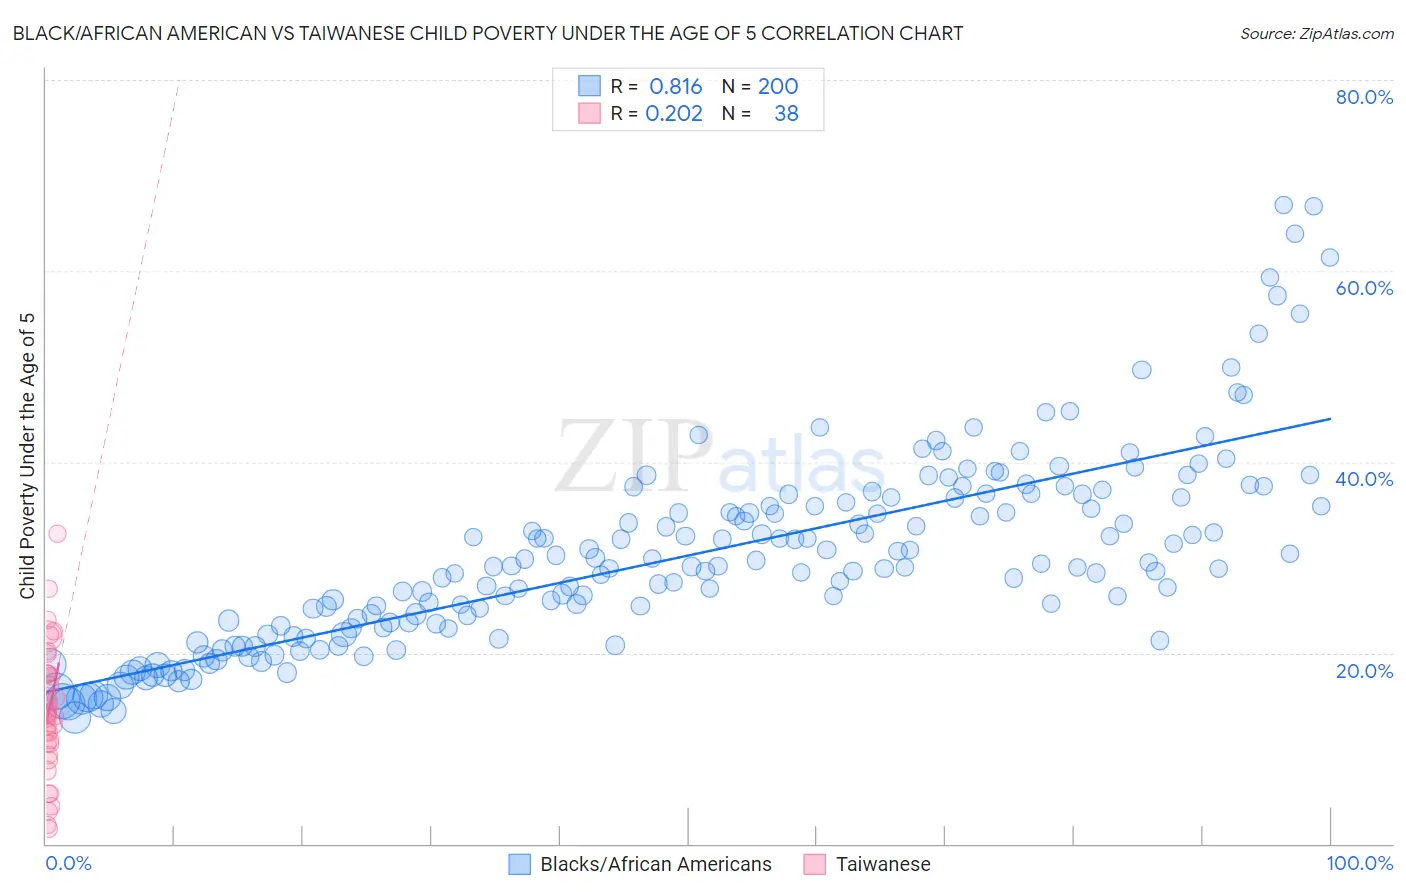
Black/African American vs Taiwanese Child Poverty Under the Age of 5 Correlation Chart
The statistical analysis conducted on geographies consisting of 529,558,738 people shows a very strong positive correlation between the proportion of Blacks/African Americans and poverty level among children under the age of 5 in the United States with a correlation coefficient (R) of 0.816 and weighted average of 25.7%. Similarly, the statistical analysis conducted on geographies consisting of 31,513,469 people shows a weak positive correlation between the proportion of Taiwanese and poverty level among children under the age of 5 in the United States with a correlation coefficient (R) of 0.202 and weighted average of 14.5%, a difference of 77.3%.
Child Poverty Under the Age of 5 Correlation Summary
| Measurement | Black/African American | Taiwanese |
| Minimum | 13.3% | 1.6% |
| Maximum | 66.9% | 32.5% |
| Range | 53.6% | 30.9% |
| Mean | 30.2% | 14.0% |
| Median | 29.0% | 13.5% |
| Interquartile 25% (IQ1) | 22.7% | 10.4% |
| Interquartile 75% (IQ3) | 36.0% | 17.8% |
| Interquartile Range (IQR) | 13.2% | 7.4% |
| Standard Deviation (Sample) | 10.2% | 6.8% |
| Standard Deviation (Population) | 10.1% | 6.8% |
Similar Demographics by Child Poverty Under the Age of 5
Demographics Similar to Blacks/African Americans by Child Poverty Under the Age of 5
In terms of child poverty under the age of 5, the demographic groups most similar to Blacks/African Americans are Colville (25.7%, a difference of 0.0%), Native/Alaskan (25.6%, a difference of 0.50%), Apache (25.0%, a difference of 2.8%), Sioux (26.9%, a difference of 4.9%), and Kiowa (24.5%, a difference of 5.0%).
| Demographics | Rating | Rank | Child Poverty Under the Age of 5 |
| Dominicans | 0.0 /100 | #327 | Tragic 24.0% |
| Immigrants | Dominican Republic | 0.0 /100 | #328 | Tragic 24.1% |
| Cajuns | 0.0 /100 | #329 | Tragic 24.1% |
| Creek | 0.0 /100 | #330 | Tragic 24.2% |
| Kiowa | 0.0 /100 | #331 | Tragic 24.5% |
| Apache | 0.0 /100 | #332 | Tragic 25.0% |
| Natives/Alaskans | 0.0 /100 | #333 | Tragic 25.6% |
| Blacks/African Americans | 0.0 /100 | #334 | Tragic 25.7% |
| Colville | 0.0 /100 | #335 | Tragic 25.7% |
| Sioux | 0.0 /100 | #336 | Tragic 26.9% |
| Pima | 0.0 /100 | #337 | Tragic 27.4% |
| Hopi | 0.0 /100 | #338 | Tragic 27.7% |
| Yup'ik | 0.0 /100 | #339 | Tragic 27.7% |
| Cheyenne | 0.0 /100 | #340 | Tragic 28.3% |
| Immigrants | Yemen | 0.0 /100 | #341 | Tragic 29.3% |
Demographics Similar to Taiwanese by Child Poverty Under the Age of 5
In terms of child poverty under the age of 5, the demographic groups most similar to Taiwanese are Immigrants from Moldova (14.5%, a difference of 0.10%), Latvian (14.5%, a difference of 0.11%), Maltese (14.5%, a difference of 0.18%), Immigrants from Sri Lanka (14.4%, a difference of 0.30%), and Turkish (14.6%, a difference of 0.52%).
| Demographics | Rating | Rank | Child Poverty Under the Age of 5 |
| Immigrants | Lithuania | 99.9 /100 | #26 | Exceptional 14.1% |
| Tongans | 99.9 /100 | #27 | Exceptional 14.2% |
| Immigrants | Indonesia | 99.8 /100 | #28 | Exceptional 14.3% |
| Immigrants | Asia | 99.8 /100 | #29 | Exceptional 14.4% |
| Cambodians | 99.8 /100 | #30 | Exceptional 14.4% |
| Koreans | 99.8 /100 | #31 | Exceptional 14.4% |
| Immigrants | Sri Lanka | 99.8 /100 | #32 | Exceptional 14.4% |
| Taiwanese | 99.8 /100 | #33 | Exceptional 14.5% |
| Immigrants | Moldova | 99.8 /100 | #34 | Exceptional 14.5% |
| Latvians | 99.8 /100 | #35 | Exceptional 14.5% |
| Maltese | 99.8 /100 | #36 | Exceptional 14.5% |
| Turks | 99.7 /100 | #37 | Exceptional 14.6% |
| Eastern Europeans | 99.7 /100 | #38 | Exceptional 14.6% |
| Norwegians | 99.7 /100 | #39 | Exceptional 14.6% |
| Immigrants | Australia | 99.7 /100 | #40 | Exceptional 14.6% |