Black/African American vs Guatemalan Child Poverty Under the Age of 5
COMPARE
Black/African American
Guatemalan
Child Poverty Under the Age of 5
Child Poverty Under the Age of 5 Comparison
Blacks/African Americans
Guatemalans
25.7%
CHILD POVERTY UNDER THE AGE OF 5
0.0/ 100
METRIC RATING
334th/ 347
METRIC RANK
21.6%
CHILD POVERTY UNDER THE AGE OF 5
0.0/ 100
METRIC RATING
294th/ 347
METRIC RANK
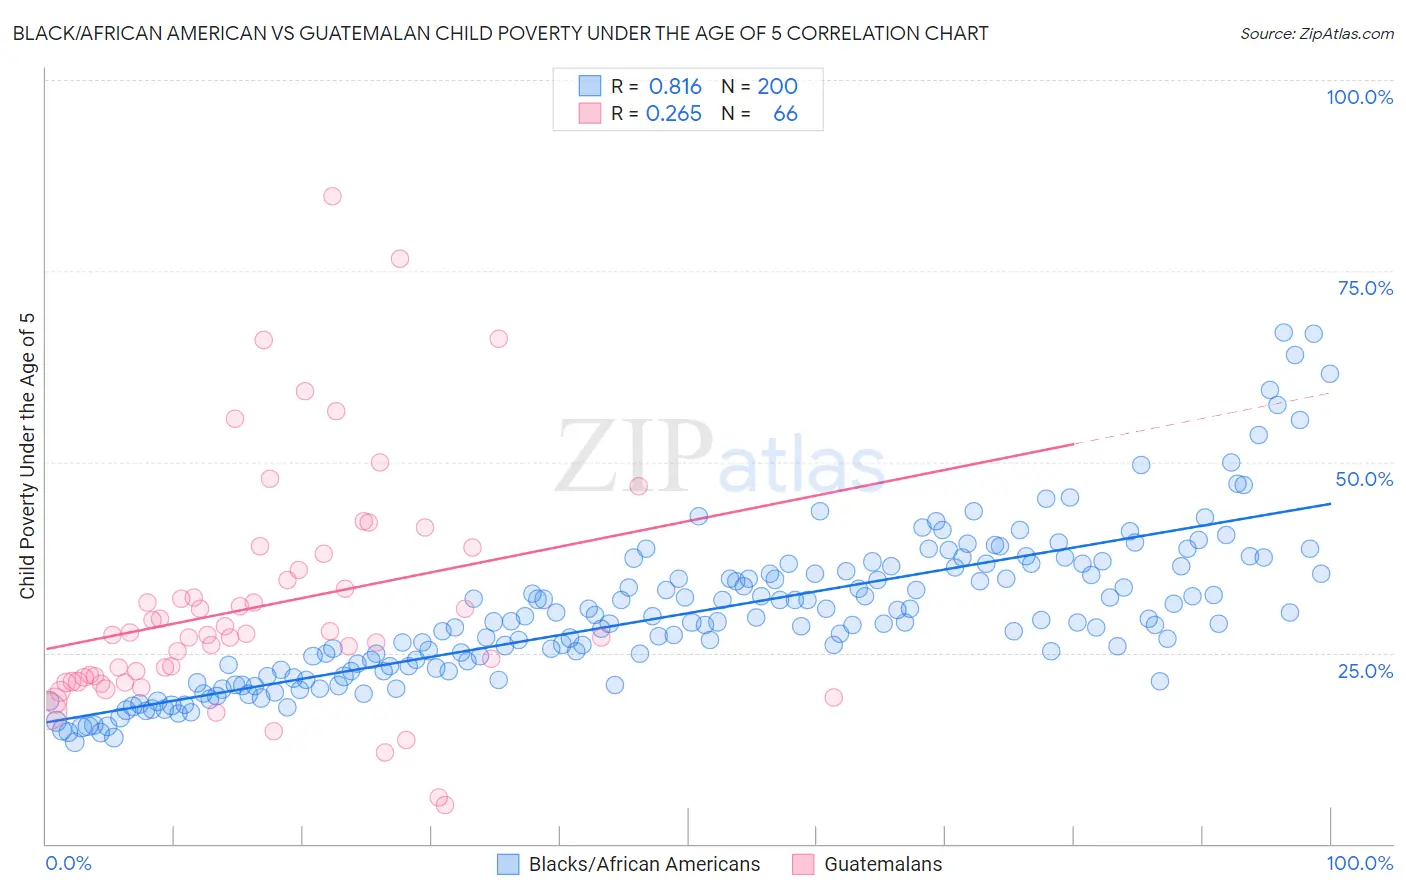
Black/African American vs Guatemalan Child Poverty Under the Age of 5 Correlation Chart
The statistical analysis conducted on geographies consisting of 529,558,738 people shows a very strong positive correlation between the proportion of Blacks/African Americans and poverty level among children under the age of 5 in the United States with a correlation coefficient (R) of 0.816 and weighted average of 25.7%. Similarly, the statistical analysis conducted on geographies consisting of 396,996,779 people shows a weak positive correlation between the proportion of Guatemalans and poverty level among children under the age of 5 in the United States with a correlation coefficient (R) of 0.265 and weighted average of 21.6%, a difference of 18.7%.
Child Poverty Under the Age of 5 Correlation Summary
| Measurement | Black/African American | Guatemalan |
| Minimum | 13.3% | 5.2% |
| Maximum | 66.9% | 84.8% |
| Range | 53.6% | 79.6% |
| Mean | 30.2% | 31.2% |
| Median | 29.0% | 27.3% |
| Interquartile 25% (IQ1) | 22.7% | 21.3% |
| Interquartile 75% (IQ3) | 36.0% | 35.9% |
| Interquartile Range (IQR) | 13.2% | 14.6% |
| Standard Deviation (Sample) | 10.2% | 15.4% |
| Standard Deviation (Population) | 10.1% | 15.3% |
Similar Demographics by Child Poverty Under the Age of 5
Demographics Similar to Blacks/African Americans by Child Poverty Under the Age of 5
In terms of child poverty under the age of 5, the demographic groups most similar to Blacks/African Americans are Colville (25.7%, a difference of 0.0%), Native/Alaskan (25.6%, a difference of 0.50%), Apache (25.0%, a difference of 2.8%), Sioux (26.9%, a difference of 4.9%), and Kiowa (24.5%, a difference of 5.0%).
| Demographics | Rating | Rank | Child Poverty Under the Age of 5 |
| Dominicans | 0.0 /100 | #327 | Tragic 24.0% |
| Immigrants | Dominican Republic | 0.0 /100 | #328 | Tragic 24.1% |
| Cajuns | 0.0 /100 | #329 | Tragic 24.1% |
| Creek | 0.0 /100 | #330 | Tragic 24.2% |
| Kiowa | 0.0 /100 | #331 | Tragic 24.5% |
| Apache | 0.0 /100 | #332 | Tragic 25.0% |
| Natives/Alaskans | 0.0 /100 | #333 | Tragic 25.6% |
| Blacks/African Americans | 0.0 /100 | #334 | Tragic 25.7% |
| Colville | 0.0 /100 | #335 | Tragic 25.7% |
| Sioux | 0.0 /100 | #336 | Tragic 26.9% |
| Pima | 0.0 /100 | #337 | Tragic 27.4% |
| Hopi | 0.0 /100 | #338 | Tragic 27.7% |
| Yup'ik | 0.0 /100 | #339 | Tragic 27.7% |
| Cheyenne | 0.0 /100 | #340 | Tragic 28.3% |
| Immigrants | Yemen | 0.0 /100 | #341 | Tragic 29.3% |
Demographics Similar to Guatemalans by Child Poverty Under the Age of 5
In terms of child poverty under the age of 5, the demographic groups most similar to Guatemalans are Mexican (21.6%, a difference of 0.14%), Cherokee (21.7%, a difference of 0.26%), Yaqui (21.7%, a difference of 0.41%), Immigrants from Somalia (21.6%, a difference of 0.42%), and Hispanic or Latino (21.7%, a difference of 0.43%).
| Demographics | Rating | Rank | Child Poverty Under the Age of 5 |
| Immigrants | Zaire | 0.0 /100 | #287 | Tragic 21.3% |
| Immigrants | Senegal | 0.0 /100 | #288 | Tragic 21.3% |
| Immigrants | Haiti | 0.0 /100 | #289 | Tragic 21.3% |
| Immigrants | Caribbean | 0.0 /100 | #290 | Tragic 21.4% |
| British West Indians | 0.0 /100 | #291 | Tragic 21.4% |
| Immigrants | Somalia | 0.0 /100 | #292 | Tragic 21.6% |
| Mexicans | 0.0 /100 | #293 | Tragic 21.6% |
| Guatemalans | 0.0 /100 | #294 | Tragic 21.6% |
| Cherokee | 0.0 /100 | #295 | Tragic 21.7% |
| Yaqui | 0.0 /100 | #296 | Tragic 21.7% |
| Hispanics or Latinos | 0.0 /100 | #297 | Tragic 21.7% |
| Blackfeet | 0.0 /100 | #298 | Tragic 21.8% |
| Chickasaw | 0.0 /100 | #299 | Tragic 21.8% |
| Alaskan Athabascans | 0.0 /100 | #300 | Tragic 21.8% |
| Immigrants | Central America | 0.0 /100 | #301 | Tragic 22.0% |