Basque vs Mexican American Indian Child Poverty Under the Age of 16

COMPARE

Basque
Race
Ancestry
AfghanAfricanAlaska NativeAlaskan AthabascanAlbanianAleutAlsatianAmericanApacheArabArapahoArgentineanArmenianAssyrian/Chaldean/SyriacAustralianAustrianBahamianBangladeshiBarbadianBasqueBelgianBelizeanBermudanBhutaneseBlackfeetBolivianBrazilianBritishBritish West IndianBulgarianBurmeseCajunCambodianCanadianCape VerdeanCarpatho RusynCelticCentral AmericanCentral American IndianCherokeeCheyenneChickasawChileanChineseChippewaChoctawColombianColvilleComancheCosta RicanCreeCreekCroatianCrowCubanCypriotCzechCzechoslovakianDanishDelawareDominicanDutchDutch West IndianEastern EuropeanEcuadorianEgyptianEnglishEstonianEthiopianEuropeanFijianFilipinoFinnishFrenchFrench American IndianFrench CanadianGermanGerman RussianGhanaianGreekGuamanian/ChamorroGuatemalanGuyaneseHaitianHmongHonduranHopiHoumaHungarianIcelanderIndian (Asian)IndonesianInupiatIranianIraqiIrishIroquoisIsraeliItalianJamaicanJapaneseJordanianKenyanKiowaKoreanLaotianLatvianLebaneseLiberianLithuanianLumbeeLuxembourgerMacedonianMalaysianMalteseMarshalleseMenomineeMexicanMongolianMoroccanNative HawaiianNavajoNepaleseNew ZealanderNicaraguanNigerianNorthern EuropeanNorwegianOkinawanOsageOttawaPaiutePakistaniPalestinianPanamanianParaguayanPennsylvania GermanPeruvianPimaPolishPortuguesePotawatomiPuebloPuerto RicanPuget Sound SalishRomanianRussianSalvadoranSamoanScandinavianScotch-IrishScottishSeminoleSenegaleseSerbianShoshoneSierra LeoneanSiouxSlavicSlovakSloveneSomaliSouth AfricanSouth AmericanSouth American IndianSoviet UnionSpaniardSpanishSpanish AmericanSpanish American IndianSri LankanSubsaharan AfricanSudaneseSwedishSwissSyrianTaiwaneseThaiTlingit-HaidaTohono O'OdhamTonganTrinidadian and TobagonianTsimshianTurkishU.S. Virgin IslanderUgandanUkrainianUruguayanUteVenezuelanVietnameseWelshWest IndianYakamaYaquiYugoslavianYumanYup'ikZimbabwean
Immigration
NonimmigrantsImmigrantsAfghanistanAfricaAlbaniaArgentinaArmeniaAsiaAustraliaAustriaBahamasBangladeshBarbadosBelarusBelgiumBelizeBoliviaBosnia and HerzegovinaBrazilBulgariaBurma/MyanmarCabo VerdeCambodiaCameroonCanadaCaribbeanCentral AmericaChileChinaColombiaCongoCosta RicaCroatiaCubaCzechoslovakiaDenmarkDominicaDominican RepublicEastern AfricaEastern AsiaEastern EuropeEcuadorEgyptEl SalvadorEnglandEritreaEthiopiaEuropeFijiFranceGermanyGhanaGreeceGrenadaGuatemalaGuyanaHaitiHondurasHong KongHungaryIndiaIndonesiaIranIraqIrelandIsraelItalyJamaicaJapanJordanKazakhstanKenyaKoreaKuwaitLaosLatin AmericaLatviaLebanonLiberiaLithuaniaMalaysiaMexicoMicronesiaMiddle AfricaMoldovaMoroccoNepalNetherlandsNicaraguaNigeriaNorth AmericaNorth MacedoniaNorthern AfricaNorthern EuropeNorwayOceaniaPakistanPanamaPeruPhilippinesPolandPortugalRomaniaRussiaSaudi ArabiaScotlandSenegalSerbiaSierra LeoneSingaporeSomaliaSouth AfricaSouth AmericaSouth Central AsiaSouth Eastern AsiaSouthern EuropeSpainSri LankaSt. Vincent and the GrenadinesSudanSwedenSwitzerlandSyriaTaiwanThailandTrinidad and TobagoTurkeyUgandaUkraineUruguayUzbekistanVenezuelaVietnamWest IndiesWestern AfricaWestern AsiaWestern EuropeYemenZaireZimbabweAzores
Mexican American Indian
Race
Ancestry
AfghanAfricanAlaska NativeAlaskan AthabascanAlbanianAleutAlsatianAmericanApacheArabArapahoArgentineanArmenianAssyrian/Chaldean/SyriacAustralianAustrianBahamianBangladeshiBarbadianBelgianBelizeanBermudanBhutaneseBlackfeetBolivianBrazilianBritishBritish West IndianBulgarianBurmeseCajunCambodianCanadianCape VerdeanCarpatho RusynCelticCentral AmericanCentral American IndianCherokeeCheyenneChickasawChileanChineseChippewaChoctawColombianColvilleComancheCosta RicanCreeCreekCroatianCrowCubanCypriotCzechCzechoslovakianDanishDelawareDominicanDutchDutch West IndianEastern EuropeanEcuadorianEgyptianEnglishEstonianEthiopianEuropeanFijianFilipinoFinnishFrenchFrench American IndianFrench CanadianGermanGerman RussianGhanaianGreekGuamanian/ChamorroGuatemalanGuyaneseHaitianHmongHonduranHopiHoumaHungarianIcelanderIndian (Asian)IndonesianInupiatIranianIraqiIrishIroquoisIsraeliItalianJamaicanJapaneseJordanianKenyanKiowaKoreanLaotianLatvianLebaneseLiberianLithuanianLumbeeLuxembourgerMacedonianMalaysianMalteseMarshalleseMenomineeMexicanMexican American IndianMongolianMoroccanNative HawaiianNavajoNepaleseNew ZealanderNicaraguanNigerianNorthern EuropeanNorwegianOkinawanOsageOttawaPaiutePakistaniPalestinianPanamanianParaguayanPennsylvania GermanPeruvianPimaPolishPortuguesePotawatomiPuebloPuerto RicanPuget Sound SalishRomanianRussianSalvadoranSamoanScandinavianScotch-IrishScottishSeminoleSenegaleseSerbianShoshoneSierra LeoneanSiouxSlavicSlovakSloveneSomaliSouth AfricanSouth AmericanSouth American IndianSoviet UnionSpaniardSpanishSpanish AmericanSpanish American IndianSri LankanSubsaharan AfricanSudaneseSwedishSwissSyrianTaiwaneseThaiTlingit-HaidaTohono O'OdhamTonganTrinidadian and TobagonianTsimshianTurkishU.S. Virgin IslanderUgandanUkrainianUruguayanUteVenezuelanVietnameseWelshWest IndianYakamaYaquiYugoslavianYumanYup'ikZimbabwean
Immigration
NonimmigrantsImmigrantsAfghanistanAfricaAlbaniaArgentinaArmeniaAsiaAustraliaAustriaBahamasBangladeshBarbadosBelarusBelgiumBelizeBoliviaBosnia and HerzegovinaBrazilBulgariaBurma/MyanmarCabo VerdeCambodiaCameroonCanadaCaribbeanCentral AmericaChileChinaColombiaCongoCosta RicaCroatiaCubaCzechoslovakiaDenmarkDominicaDominican RepublicEastern AfricaEastern AsiaEastern EuropeEcuadorEgyptEl SalvadorEnglandEritreaEthiopiaEuropeFijiFranceGermanyGhanaGreeceGrenadaGuatemalaGuyanaHaitiHondurasHong KongHungaryIndiaIndonesiaIranIraqIrelandIsraelItalyJamaicaJapanJordanKazakhstanKenyaKoreaKuwaitLaosLatin AmericaLatviaLebanonLiberiaLithuaniaMalaysiaMexicoMicronesiaMiddle AfricaMoldovaMoroccoNepalNetherlandsNicaraguaNigeriaNorth AmericaNorth MacedoniaNorthern AfricaNorthern EuropeNorwayOceaniaPakistanPanamaPeruPhilippinesPolandPortugalRomaniaRussiaSaudi ArabiaScotlandSenegalSerbiaSierra LeoneSingaporeSomaliaSouth AfricaSouth AmericaSouth Central AsiaSouth Eastern AsiaSouthern EuropeSpainSri LankaSt. Vincent and the GrenadinesSudanSwedenSwitzerlandSyriaTaiwanThailandTrinidad and TobagoTurkeyUgandaUkraineUruguayUzbekistanVenezuelaVietnamWest IndiesWestern AfricaWestern AsiaWestern EuropeYemenZaireZimbabweAzores
Child Poverty Under the Age of 16
Income
Poverty
Unemployment
Labor Participation
Family Structure
Vehicle Availability
Education Level
Disability

Child Poverty Under the Age of 16 Comparison

Basques

Mexican American Indians

Exceptional
Tragic
14.8%
CHILD POVERTY UNDER THE AGE OF 16
94.7/ 100
METRIC RATING
105th/ 347
METRIC RANK
19.3%
CHILD POVERTY UNDER THE AGE OF 16
0.2/ 100
METRIC RATING
259th/ 347
METRIC RANK

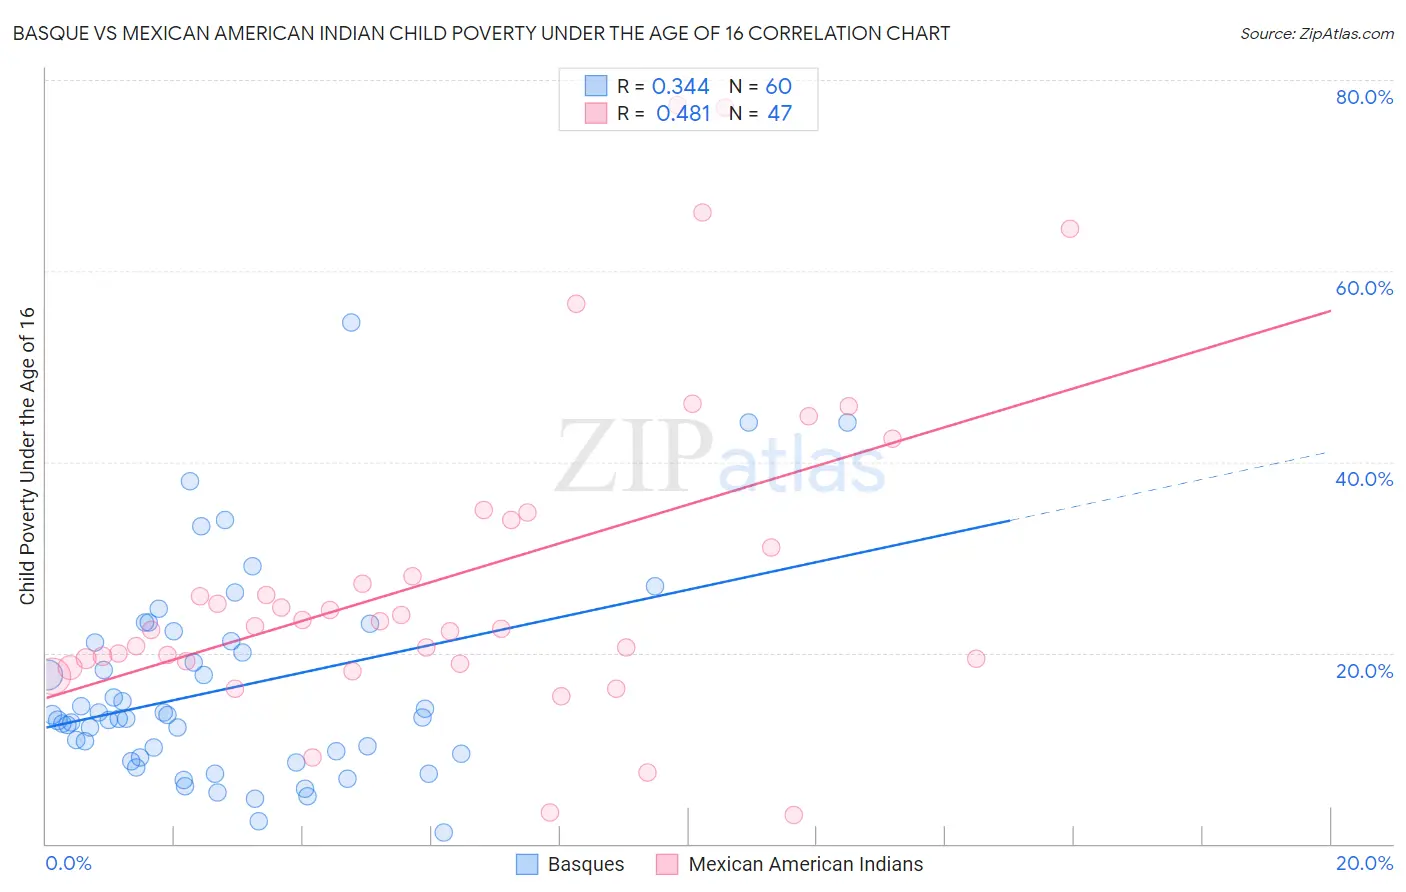
Basque vs Mexican American Indian Child Poverty Under the Age of 16 Correlation Chart

The statistical analysis conducted on geographies consisting of 165,163,292 people shows a mild positive correlation between the proportion of Basques and poverty level among children under the age of 16 in the United States with a correlation coefficient (R) of 0.344 and weighted average of 14.8%. Similarly, the statistical analysis conducted on geographies consisting of 316,640,167 people shows a moderate positive correlation between the proportion of Mexican American Indians and poverty level among children under the age of 16 in the United States with a correlation coefficient (R) of 0.481 and weighted average of 19.3%, a difference of 30.5%.
Basque vs Mexican American Indian Child Poverty Under the Age of 16

Child Poverty Under the Age of 16 Correlation Summary

MeasurementBasqueMexican American Indian
Minimum1.2%3.0%
Maximum54.6%77.4%
Range53.4%74.4%
Mean16.3%28.1%
Median13.2%22.7%
Interquartile 25% (IQ1)9.2%19.1%
Interquartile 75% (IQ3)21.1%33.9%
Interquartile Range (IQR)11.9%14.8%
Standard Deviation (Sample)10.7%17.0%
Standard Deviation (Population)10.6%16.9%

Similar Demographics by Child Poverty Under the Age of 16

Demographics Similar to Basques by Child Poverty Under the Age of 16

In terms of child poverty under the age of 16, the demographic groups most similar to Basques are Immigrants from England (14.8%, a difference of 0.11%), Serbian (14.8%, a difference of 0.13%), Immigrants from Egypt (14.8%, a difference of 0.15%), Chilean (14.8%, a difference of 0.19%), and Romanian (14.8%, a difference of 0.20%).
DemographicsRating | RankChild Poverty Under the Age of 16
Immigrants | Belarus
95.7
/100
|
#98
Exceptional
14.7%
British
95.5
/100
|
#99
Exceptional
14.7%
Dutch
95.1
/100
|
#100
Exceptional
14.8%
Immigrants | Switzerland
95.1
/100
|
#101
Exceptional
14.8%
Romanians
95.0
/100
|
#102
Exceptional
14.8%
Immigrants | Egypt
94.9
/100
|
#103
Exceptional
14.8%
Immigrants | England
94.8
/100
|
#104
Exceptional
14.8%
Basques
94.7
/100
|
#105
Exceptional
14.8%
Serbians
94.5
/100
|
#106
Exceptional
14.8%
Chileans
94.4
/100
|
#107
Exceptional
14.8%
Jordanians
94.2
/100
|
#108
Exceptional
14.8%
Tlingit-Haida
94.1
/100
|
#109
Exceptional
14.9%
English
93.5
/100
|
#110
Exceptional
14.9%
Immigrants | Denmark
93.5
/100
|
#111
Exceptional
14.9%
Irish
93.4
/100
|
#112
Exceptional
14.9%

Demographics Similar to Mexican American Indians by Child Poverty Under the Age of 16

In terms of child poverty under the age of 16, the demographic groups most similar to Mexican American Indians are Guyanese (19.3%, a difference of 0.10%), Immigrants from Burma/Myanmar (19.4%, a difference of 0.18%), Immigrants from Guyana (19.4%, a difference of 0.22%), Vietnamese (19.4%, a difference of 0.54%), and Spanish American (19.2%, a difference of 0.55%).
DemographicsRating | RankChild Poverty Under the Age of 16
Immigrants | Trinidad and Tobago
0.3
/100
|
#252
Tragic
19.1%
Salvadorans
0.3
/100
|
#253
Tragic
19.1%
Immigrants | Western Africa
0.2
/100
|
#254
Tragic
19.2%
Trinidadians and Tobagonians
0.2
/100
|
#255
Tragic
19.2%
Inupiat
0.2
/100
|
#256
Tragic
19.2%
Ottawa
0.2
/100
|
#257
Tragic
19.2%
Spanish Americans
0.2
/100
|
#258
Tragic
19.2%
Mexican American Indians
0.2
/100
|
#259
Tragic
19.3%
Guyanese
0.2
/100
|
#260
Tragic
19.3%
Immigrants | Burma/Myanmar
0.1
/100
|
#261
Tragic
19.4%
Immigrants | Guyana
0.1
/100
|
#262
Tragic
19.4%
Vietnamese
0.1
/100
|
#263
Tragic
19.4%
Immigrants | Ecuador
0.1
/100
|
#264
Tragic
19.4%
Chickasaw
0.1
/100
|
#265
Tragic
19.5%
Liberians
0.1
/100
|
#266
Tragic
19.5%