Bangladeshi vs French American Indian Female Poverty
COMPARE
Bangladeshi
French American Indian
Female Poverty
Female Poverty Comparison
Bangladeshis
French American Indians
16.0%
FEMALE POVERTY
0.0/ 100
METRIC RATING
277th/ 347
METRIC RANK
15.1%
FEMALE POVERTY
0.6/ 100
METRIC RATING
237th/ 347
METRIC RANK
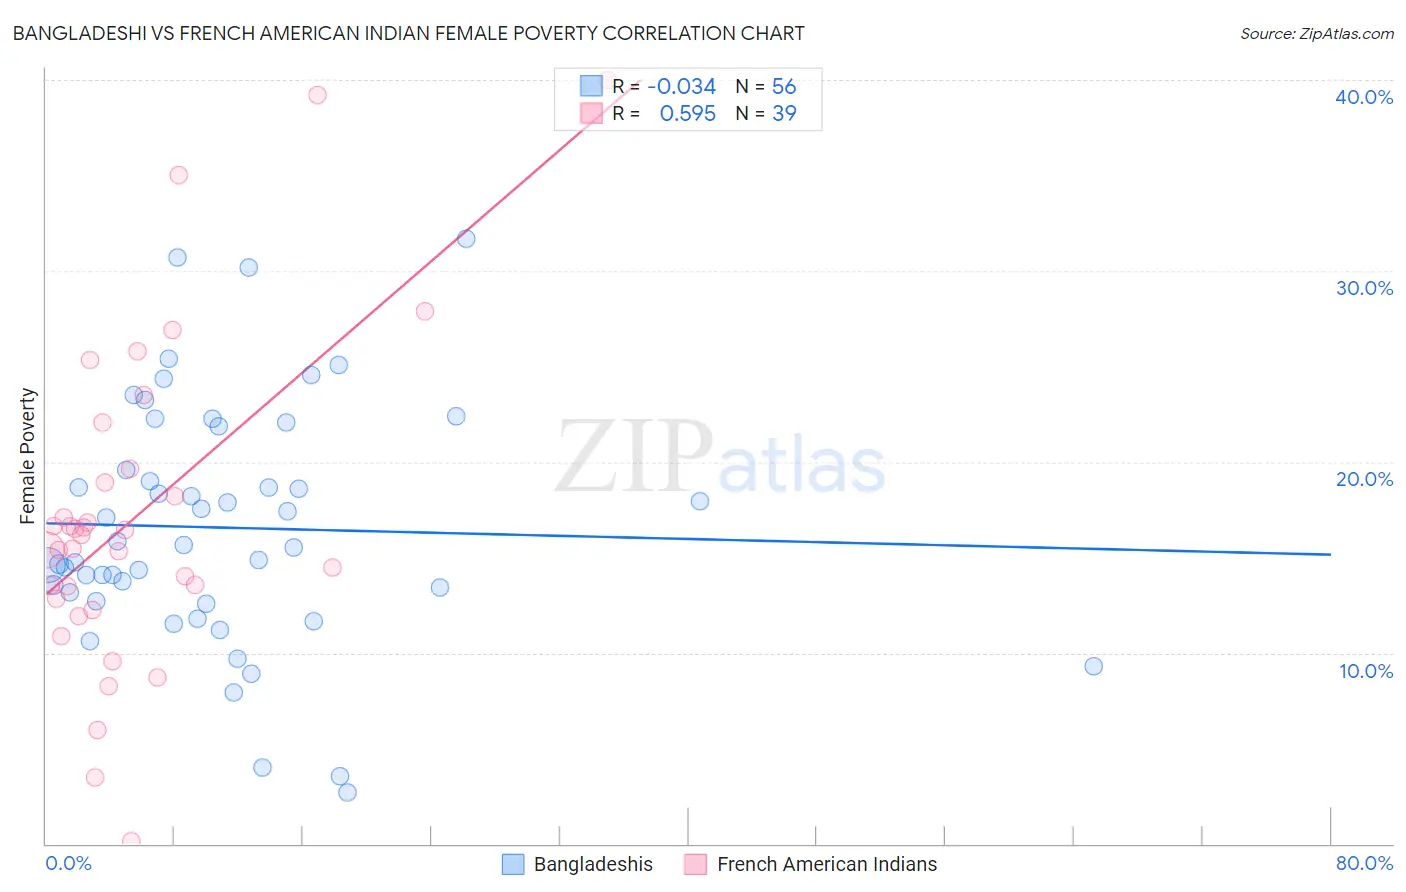
Bangladeshi vs French American Indian Female Poverty Correlation Chart
The statistical analysis conducted on geographies consisting of 141,353,886 people shows no correlation between the proportion of Bangladeshis and poverty level among females in the United States with a correlation coefficient (R) of -0.034 and weighted average of 16.0%. Similarly, the statistical analysis conducted on geographies consisting of 131,968,938 people shows a substantial positive correlation between the proportion of French American Indians and poverty level among females in the United States with a correlation coefficient (R) of 0.595 and weighted average of 15.1%, a difference of 6.1%.
Female Poverty Correlation Summary
| Measurement | Bangladeshi | French American Indian |
| Minimum | 2.7% | 0.16% |
| Maximum | 31.7% | 40.0% |
| Range | 29.0% | 39.8% |
| Mean | 16.6% | 17.2% |
| Median | 15.6% | 16.2% |
| Interquartile 25% (IQ1) | 12.9% | 12.8% |
| Interquartile 75% (IQ3) | 20.7% | 19.6% |
| Interquartile Range (IQR) | 7.8% | 6.8% |
| Standard Deviation (Sample) | 6.3% | 8.5% |
| Standard Deviation (Population) | 6.2% | 8.4% |
Similar Demographics by Female Poverty
Demographics Similar to Bangladeshis by Female Poverty
In terms of female poverty, the demographic groups most similar to Bangladeshis are Central American (16.0%, a difference of 0.19%), Immigrants from Barbados (16.0%, a difference of 0.31%), Immigrants from West Indies (16.1%, a difference of 0.31%), Haitian (15.9%, a difference of 0.38%), and Barbadian (15.9%, a difference of 0.38%).
| Demographics | Rating | Rank | Female Poverty |
| Chickasaw | 0.1 /100 | #270 | Tragic 15.9% |
| Immigrants | St. Vincent and the Grenadines | 0.0 /100 | #271 | Tragic 15.9% |
| Belizeans | 0.0 /100 | #272 | Tragic 15.9% |
| Haitians | 0.0 /100 | #273 | Tragic 15.9% |
| Barbadians | 0.0 /100 | #274 | Tragic 15.9% |
| Immigrants | Barbados | 0.0 /100 | #275 | Tragic 16.0% |
| Central Americans | 0.0 /100 | #276 | Tragic 16.0% |
| Bangladeshis | 0.0 /100 | #277 | Tragic 16.0% |
| Immigrants | West Indies | 0.0 /100 | #278 | Tragic 16.1% |
| Immigrants | Bahamas | 0.0 /100 | #279 | Tragic 16.1% |
| Vietnamese | 0.0 /100 | #280 | Tragic 16.1% |
| West Indians | 0.0 /100 | #281 | Tragic 16.1% |
| Immigrants | Haiti | 0.0 /100 | #282 | Tragic 16.1% |
| Immigrants | Cuba | 0.0 /100 | #283 | Tragic 16.1% |
| Spanish Americans | 0.0 /100 | #284 | Tragic 16.2% |
Demographics Similar to French American Indians by Female Poverty
In terms of female poverty, the demographic groups most similar to French American Indians are Immigrants from Armenia (15.1%, a difference of 0.080%), Cree (15.1%, a difference of 0.19%), Immigrants from Middle Africa (15.2%, a difference of 0.59%), Sudanese (15.2%, a difference of 0.65%), and Immigrants from Laos (15.0%, a difference of 0.82%).
| Demographics | Rating | Rank | Female Poverty |
| Alaska Natives | 1.8 /100 | #230 | Tragic 14.7% |
| Nigerians | 1.7 /100 | #231 | Tragic 14.8% |
| Osage | 1.5 /100 | #232 | Tragic 14.8% |
| Immigrants | Saudi Arabia | 1.4 /100 | #233 | Tragic 14.8% |
| Fijians | 1.1 /100 | #234 | Tragic 14.9% |
| Immigrants | Laos | 0.9 /100 | #235 | Tragic 15.0% |
| Cree | 0.7 /100 | #236 | Tragic 15.1% |
| French American Indians | 0.6 /100 | #237 | Tragic 15.1% |
| Immigrants | Armenia | 0.6 /100 | #238 | Tragic 15.1% |
| Immigrants | Middle Africa | 0.5 /100 | #239 | Tragic 15.2% |
| Sudanese | 0.5 /100 | #240 | Tragic 15.2% |
| Immigrants | Sudan | 0.4 /100 | #241 | Tragic 15.2% |
| Nepalese | 0.4 /100 | #242 | Tragic 15.2% |
| Nicaraguans | 0.3 /100 | #243 | Tragic 15.3% |
| Ecuadorians | 0.3 /100 | #244 | Tragic 15.3% |