Armenian vs Luxembourger Female Poverty Among 18-24 Year Olds
COMPARE
Armenian
Luxembourger
Female Poverty Among 18-24 Year Olds
Female Poverty Among 18-24 Year Olds Comparison
Armenians
Luxembourgers
18.7%
FEMALE POVERTY AMONG 18-24 YEAR OLDS
99.7/ 100
METRIC RATING
72nd/ 347
METRIC RANK
20.9%
FEMALE POVERTY AMONG 18-24 YEAR OLDS
4.2/ 100
METRIC RATING
240th/ 347
METRIC RANK
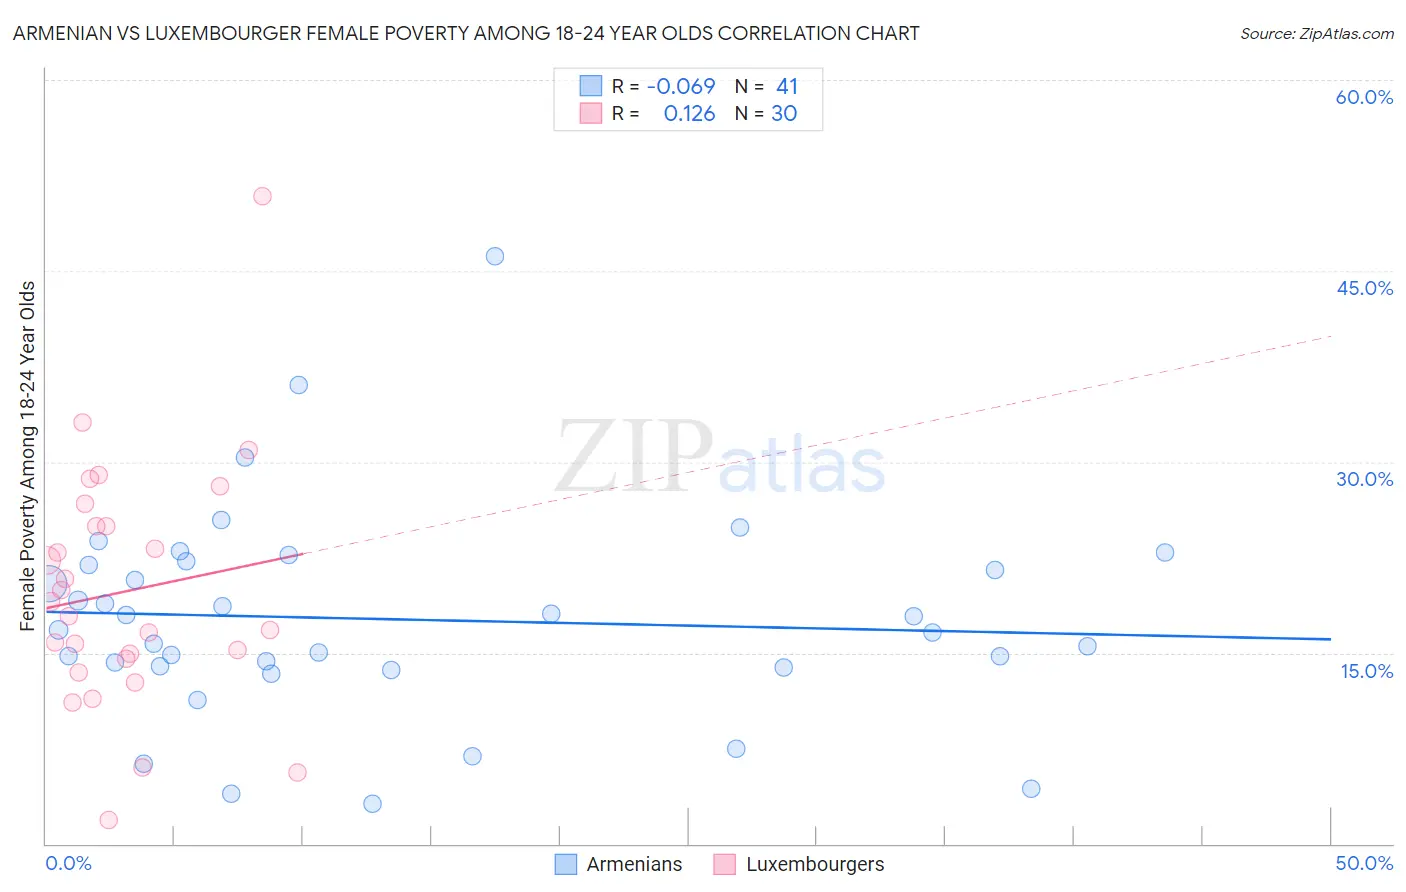
Armenian vs Luxembourger Female Poverty Among 18-24 Year Olds Correlation Chart
The statistical analysis conducted on geographies consisting of 303,307,644 people shows a slight negative correlation between the proportion of Armenians and poverty level among females between the ages 18 and 24 in the United States with a correlation coefficient (R) of -0.069 and weighted average of 18.7%. Similarly, the statistical analysis conducted on geographies consisting of 142,199,227 people shows a poor positive correlation between the proportion of Luxembourgers and poverty level among females between the ages 18 and 24 in the United States with a correlation coefficient (R) of 0.126 and weighted average of 20.9%, a difference of 11.7%.
Female Poverty Among 18-24 Year Olds Correlation Summary
| Measurement | Armenian | Luxembourger |
| Minimum | 3.1% | 1.9% |
| Maximum | 46.2% | 50.8% |
| Range | 43.0% | 49.0% |
| Mean | 17.6% | 19.8% |
| Median | 16.8% | 18.4% |
| Interquartile 25% (IQ1) | 13.9% | 14.5% |
| Interquartile 75% (IQ3) | 22.1% | 24.9% |
| Interquartile Range (IQR) | 8.2% | 10.5% |
| Standard Deviation (Sample) | 8.2% | 9.7% |
| Standard Deviation (Population) | 8.1% | 9.5% |
Similar Demographics by Female Poverty Among 18-24 Year Olds
Demographics Similar to Armenians by Female Poverty Among 18-24 Year Olds
In terms of female poverty among 18-24 year olds, the demographic groups most similar to Armenians are Immigrants from Haiti (18.7%, a difference of 0.020%), Lithuanian (18.7%, a difference of 0.040%), Immigrants from Costa Rica (18.7%, a difference of 0.090%), Immigrants from Bulgaria (18.6%, a difference of 0.19%), and Hawaiian (18.7%, a difference of 0.22%).
| Demographics | Rating | Rank | Female Poverty Among 18-24 Year Olds |
| Immigrants | Scotland | 99.8 /100 | #65 | Exceptional 18.6% |
| Jordanians | 99.8 /100 | #66 | Exceptional 18.6% |
| Immigrants | Korea | 99.8 /100 | #67 | Exceptional 18.6% |
| Brazilians | 99.8 /100 | #68 | Exceptional 18.6% |
| Immigrants | Bulgaria | 99.7 /100 | #69 | Exceptional 18.6% |
| Immigrants | Costa Rica | 99.7 /100 | #70 | Exceptional 18.7% |
| Immigrants | Haiti | 99.7 /100 | #71 | Exceptional 18.7% |
| Armenians | 99.7 /100 | #72 | Exceptional 18.7% |
| Lithuanians | 99.7 /100 | #73 | Exceptional 18.7% |
| Hawaiians | 99.6 /100 | #74 | Exceptional 18.7% |
| Poles | 99.6 /100 | #75 | Exceptional 18.8% |
| Immigrants | Cambodia | 99.5 /100 | #76 | Exceptional 18.8% |
| Costa Ricans | 99.5 /100 | #77 | Exceptional 18.8% |
| Immigrants | Europe | 99.5 /100 | #78 | Exceptional 18.8% |
| Uruguayans | 99.5 /100 | #79 | Exceptional 18.8% |
Demographics Similar to Luxembourgers by Female Poverty Among 18-24 Year Olds
In terms of female poverty among 18-24 year olds, the demographic groups most similar to Luxembourgers are Immigrants from Eritrea (20.9%, a difference of 0.020%), Immigrants from Guatemala (20.9%, a difference of 0.030%), Israeli (20.9%, a difference of 0.030%), Immigrants from Singapore (20.9%, a difference of 0.040%), and Scottish (20.9%, a difference of 0.070%).
| Demographics | Rating | Rank | Female Poverty Among 18-24 Year Olds |
| Immigrants | Denmark | 5.8 /100 | #233 | Tragic 20.8% |
| Welsh | 5.4 /100 | #234 | Tragic 20.8% |
| Immigrants | Uganda | 5.1 /100 | #235 | Tragic 20.8% |
| Okinawans | 4.9 /100 | #236 | Tragic 20.8% |
| Scottish | 4.5 /100 | #237 | Tragic 20.9% |
| Immigrants | Singapore | 4.4 /100 | #238 | Tragic 20.9% |
| Immigrants | Guatemala | 4.3 /100 | #239 | Tragic 20.9% |
| Luxembourgers | 4.2 /100 | #240 | Tragic 20.9% |
| Immigrants | Eritrea | 4.2 /100 | #241 | Tragic 20.9% |
| Israelis | 4.1 /100 | #242 | Tragic 20.9% |
| Marshallese | 3.4 /100 | #243 | Tragic 20.9% |
| Immigrants | Thailand | 3.4 /100 | #244 | Tragic 20.9% |
| Aleuts | 3.3 /100 | #245 | Tragic 20.9% |
| Immigrants | Australia | 3.1 /100 | #246 | Tragic 20.9% |
| Immigrants | Africa | 3.0 /100 | #247 | Tragic 21.0% |