Argentinean vs Nonimmigrants Male Poverty
COMPARE
Argentinean
Nonimmigrants
Male Poverty
Male Poverty Comparison
Argentineans
Nonimmigrants
10.6%
MALE POVERTY
90.1/ 100
METRIC RATING
110th/ 347
METRIC RANK
12.1%
MALE POVERTY
3.1/ 100
METRIC RATING
213th/ 347
METRIC RANK
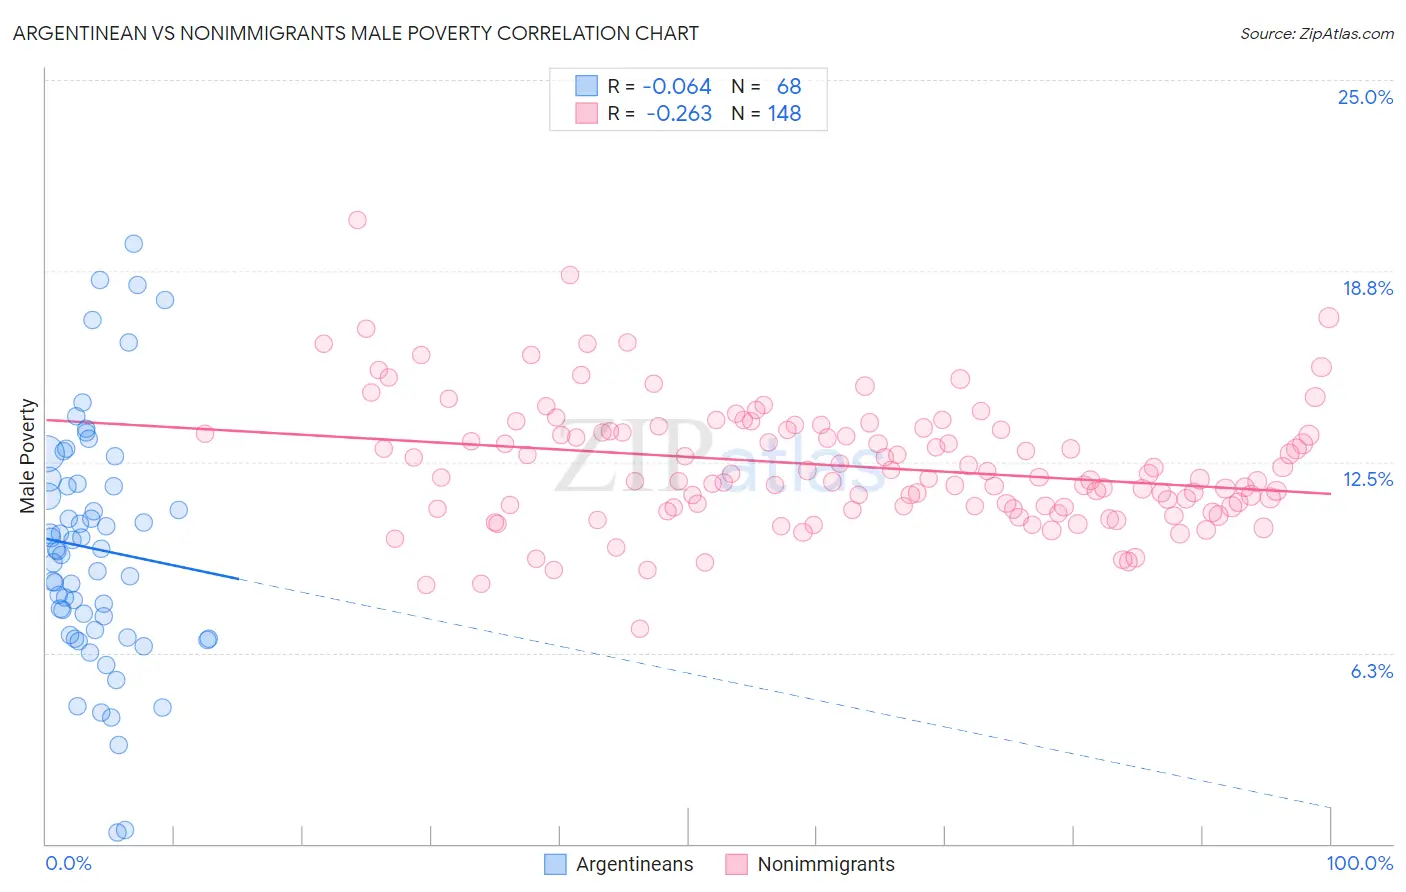
Argentinean vs Nonimmigrants Male Poverty Correlation Chart
The statistical analysis conducted on geographies consisting of 296,917,250 people shows a slight negative correlation between the proportion of Argentineans and poverty level among males in the United States with a correlation coefficient (R) of -0.064 and weighted average of 10.6%. Similarly, the statistical analysis conducted on geographies consisting of 582,696,583 people shows a weak negative correlation between the proportion of Nonimmigrants and poverty level among males in the United States with a correlation coefficient (R) of -0.263 and weighted average of 12.1%, a difference of 14.6%.
Male Poverty Correlation Summary
| Measurement | Argentinean | Nonimmigrants |
| Minimum | 0.38% | 7.0% |
| Maximum | 19.6% | 20.4% |
| Range | 19.3% | 13.4% |
| Mean | 9.7% | 12.4% |
| Median | 9.6% | 12.0% |
| Interquartile 25% (IQ1) | 6.9% | 11.0% |
| Interquartile 75% (IQ3) | 11.7% | 13.5% |
| Interquartile Range (IQR) | 4.8% | 2.5% |
| Standard Deviation (Sample) | 3.9% | 2.0% |
| Standard Deviation (Population) | 3.9% | 2.0% |
Similar Demographics by Male Poverty
Demographics Similar to Argentineans by Male Poverty
In terms of male poverty, the demographic groups most similar to Argentineans are Immigrants from Argentina (10.6%, a difference of 0.11%), Albanian (10.6%, a difference of 0.13%), Immigrants from Turkey (10.6%, a difference of 0.19%), Portuguese (10.6%, a difference of 0.26%), and Palestinian (10.6%, a difference of 0.29%).
| Demographics | Rating | Rank | Male Poverty |
| Slavs | 91.7 /100 | #103 | Exceptional 10.5% |
| Welsh | 91.6 /100 | #104 | Exceptional 10.5% |
| Canadians | 91.6 /100 | #105 | Exceptional 10.5% |
| Immigrants | Southern Europe | 91.3 /100 | #106 | Exceptional 10.5% |
| Laotians | 91.2 /100 | #107 | Exceptional 10.5% |
| Portuguese | 91.0 /100 | #108 | Exceptional 10.6% |
| Albanians | 90.6 /100 | #109 | Exceptional 10.6% |
| Argentineans | 90.1 /100 | #110 | Exceptional 10.6% |
| Immigrants | Argentina | 89.8 /100 | #111 | Excellent 10.6% |
| Immigrants | Turkey | 89.5 /100 | #112 | Excellent 10.6% |
| Palestinians | 89.1 /100 | #113 | Excellent 10.6% |
| Immigrants | Brazil | 89.0 /100 | #114 | Excellent 10.6% |
| Immigrants | Russia | 88.6 /100 | #115 | Excellent 10.6% |
| Sri Lankans | 88.1 /100 | #116 | Excellent 10.6% |
| Immigrants | South Eastern Asia | 88.1 /100 | #117 | Excellent 10.6% |
Demographics Similar to Nonimmigrants by Male Poverty
In terms of male poverty, the demographic groups most similar to Nonimmigrants are American (12.1%, a difference of 0.040%), Japanese (12.2%, a difference of 0.32%), Immigrants from Uzbekistan (12.2%, a difference of 0.43%), Immigrants from Cambodia (12.2%, a difference of 0.51%), and Immigrants from Thailand (12.2%, a difference of 0.52%).
| Demographics | Rating | Rank | Male Poverty |
| Immigrants | Eastern Africa | 5.4 /100 | #206 | Tragic 12.0% |
| Malaysians | 5.2 /100 | #207 | Tragic 12.0% |
| Immigrants | Immigrants | 4.5 /100 | #208 | Tragic 12.0% |
| Immigrants | Azores | 4.3 /100 | #209 | Tragic 12.0% |
| Moroccans | 4.2 /100 | #210 | Tragic 12.0% |
| Immigrants | Panama | 4.0 /100 | #211 | Tragic 12.1% |
| Americans | 3.2 /100 | #212 | Tragic 12.1% |
| Immigrants | Nonimmigrants | 3.1 /100 | #213 | Tragic 12.1% |
| Japanese | 2.7 /100 | #214 | Tragic 12.2% |
| Immigrants | Uzbekistan | 2.6 /100 | #215 | Tragic 12.2% |
| Immigrants | Cambodia | 2.5 /100 | #216 | Tragic 12.2% |
| Immigrants | Thailand | 2.5 /100 | #217 | Tragic 12.2% |
| German Russians | 2.5 /100 | #218 | Tragic 12.2% |
| Bermudans | 2.4 /100 | #219 | Tragic 12.2% |
| Immigrants | Eritrea | 2.4 /100 | #220 | Tragic 12.2% |