Alaska Native vs Immigrants from South America Female Poverty Among 25-34 Year Olds
COMPARE
Alaska Native
Immigrants from South America
Female Poverty Among 25-34 Year Olds
Female Poverty Among 25-34 Year Olds Comparison
Alaska Natives
Immigrants from South America
16.8%
FEMALE POVERTY AMONG 25-34 YEAR OLDS
0.0/ 100
METRIC RATING
302nd/ 347
METRIC RANK
13.3%
FEMALE POVERTY AMONG 25-34 YEAR OLDS
66.3/ 100
METRIC RATING
160th/ 347
METRIC RANK
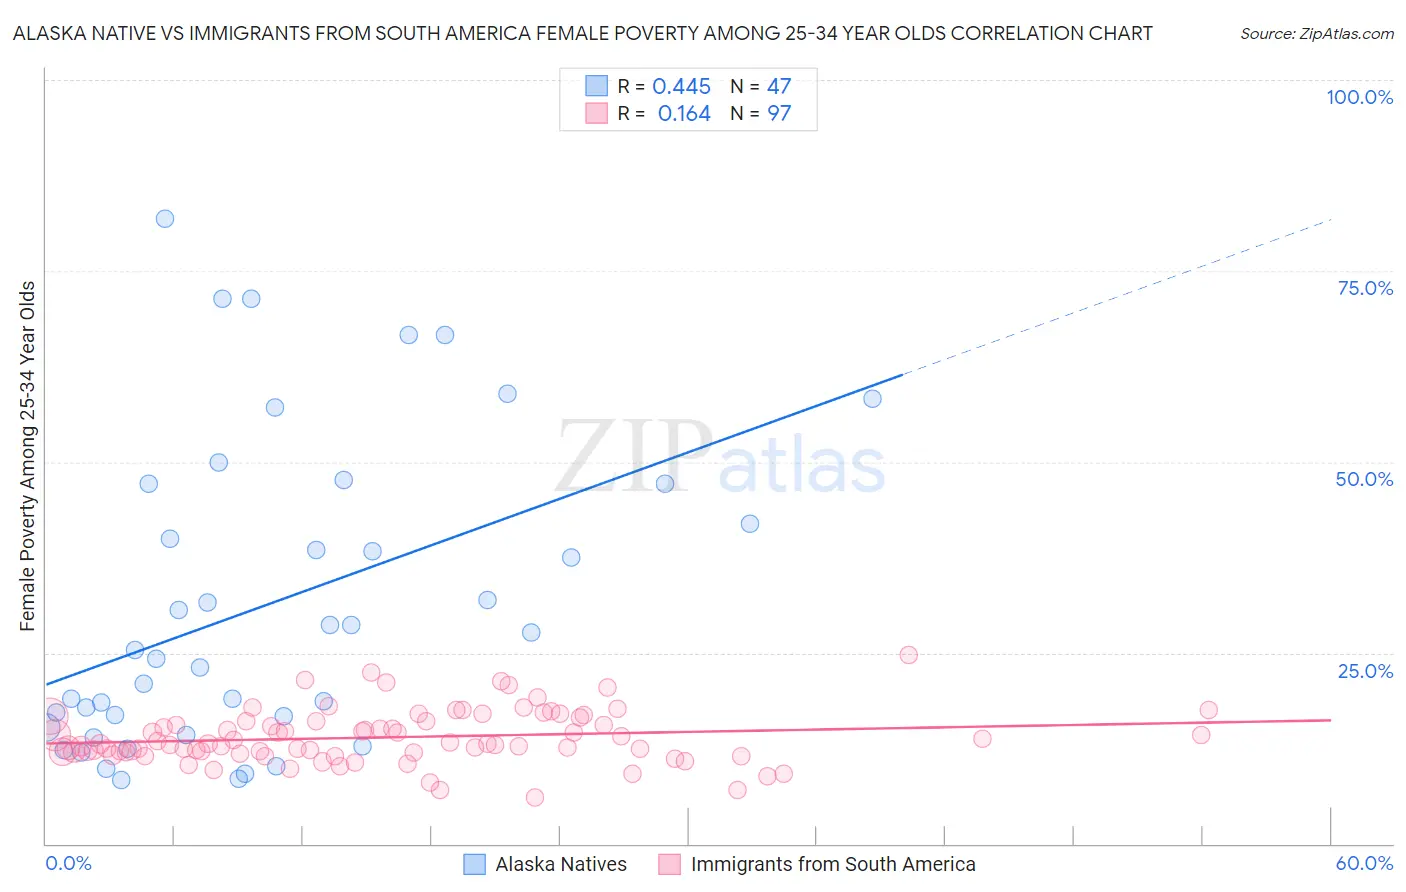
Alaska Native vs Immigrants from South America Female Poverty Among 25-34 Year Olds Correlation Chart
The statistical analysis conducted on geographies consisting of 76,506,826 people shows a moderate positive correlation between the proportion of Alaska Natives and poverty level among females between the ages 25 and 34 in the United States with a correlation coefficient (R) of 0.445 and weighted average of 16.8%. Similarly, the statistical analysis conducted on geographies consisting of 474,939,688 people shows a poor positive correlation between the proportion of Immigrants from South America and poverty level among females between the ages 25 and 34 in the United States with a correlation coefficient (R) of 0.164 and weighted average of 13.3%, a difference of 25.7%.
Female Poverty Among 25-34 Year Olds Correlation Summary
| Measurement | Alaska Native | Immigrants from South America |
| Minimum | 8.3% | 6.1% |
| Maximum | 81.8% | 24.6% |
| Range | 73.5% | 18.5% |
| Mean | 31.4% | 13.9% |
| Median | 25.4% | 13.1% |
| Interquartile 25% (IQ1) | 15.2% | 12.0% |
| Interquartile 75% (IQ3) | 47.1% | 16.1% |
| Interquartile Range (IQR) | 31.8% | 4.1% |
| Standard Deviation (Sample) | 20.0% | 3.5% |
| Standard Deviation (Population) | 19.8% | 3.4% |
Similar Demographics by Female Poverty Among 25-34 Year Olds
Demographics Similar to Alaska Natives by Female Poverty Among 25-34 Year Olds
In terms of female poverty among 25-34 year olds, the demographic groups most similar to Alaska Natives are Immigrants from Congo (16.7%, a difference of 0.11%), U.S. Virgin Islander (16.7%, a difference of 0.12%), Spanish American (16.7%, a difference of 0.27%), Blackfeet (16.7%, a difference of 0.31%), and Immigrants from Mexico (16.8%, a difference of 0.31%).
| Demographics | Rating | Rank | Female Poverty Among 25-34 Year Olds |
| Mexicans | 0.0 /100 | #295 | Tragic 16.6% |
| Hispanics or Latinos | 0.0 /100 | #296 | Tragic 16.6% |
| Immigrants | Guatemala | 0.0 /100 | #297 | Tragic 16.6% |
| Blackfeet | 0.0 /100 | #298 | Tragic 16.7% |
| Spanish Americans | 0.0 /100 | #299 | Tragic 16.7% |
| U.S. Virgin Islanders | 0.0 /100 | #300 | Tragic 16.7% |
| Immigrants | Congo | 0.0 /100 | #301 | Tragic 16.7% |
| Alaska Natives | 0.0 /100 | #302 | Tragic 16.8% |
| Immigrants | Mexico | 0.0 /100 | #303 | Tragic 16.8% |
| Hondurans | 0.0 /100 | #304 | Tragic 16.9% |
| Immigrants | Cabo Verde | 0.0 /100 | #305 | Tragic 16.9% |
| Chickasaw | 0.0 /100 | #306 | Tragic 17.0% |
| Yaqui | 0.0 /100 | #307 | Tragic 17.0% |
| Africans | 0.0 /100 | #308 | Tragic 17.0% |
| Ottawa | 0.0 /100 | #309 | Tragic 17.1% |
Demographics Similar to Immigrants from South America by Female Poverty Among 25-34 Year Olds
In terms of female poverty among 25-34 year olds, the demographic groups most similar to Immigrants from South America are Uruguayan (13.3%, a difference of 0.050%), Icelander (13.3%, a difference of 0.060%), Ugandan (13.4%, a difference of 0.21%), British (13.4%, a difference of 0.26%), and Immigrants from Colombia (13.3%, a difference of 0.28%).
| Demographics | Rating | Rank | Female Poverty Among 25-34 Year Olds |
| Northern Europeans | 73.7 /100 | #153 | Good 13.2% |
| Arabs | 73.5 /100 | #154 | Good 13.2% |
| Immigrants | Sierra Leone | 72.9 /100 | #155 | Good 13.3% |
| Immigrants | Cameroon | 72.0 /100 | #156 | Good 13.3% |
| Immigrants | Western Europe | 70.3 /100 | #157 | Good 13.3% |
| Immigrants | Colombia | 69.2 /100 | #158 | Good 13.3% |
| Uruguayans | 66.9 /100 | #159 | Good 13.3% |
| Immigrants | South America | 66.3 /100 | #160 | Good 13.3% |
| Icelanders | 65.7 /100 | #161 | Good 13.3% |
| Ugandans | 64.1 /100 | #162 | Good 13.4% |
| British | 63.5 /100 | #163 | Good 13.4% |
| Swiss | 61.7 /100 | #164 | Good 13.4% |
| Basques | 59.3 /100 | #165 | Average 13.4% |
| Belgians | 58.9 /100 | #166 | Average 13.4% |
| Immigrants | Bosnia and Herzegovina | 58.6 /100 | #167 | Average 13.4% |