Zip Codes with the Highest Percentage of Population Employed in Installation, Maintenance & Repair in Hillsboro, OR
RELATED REPORTS & OPTIONS
Installation, Maintenance & Repair
Hillsboro
Compare Zip Codes
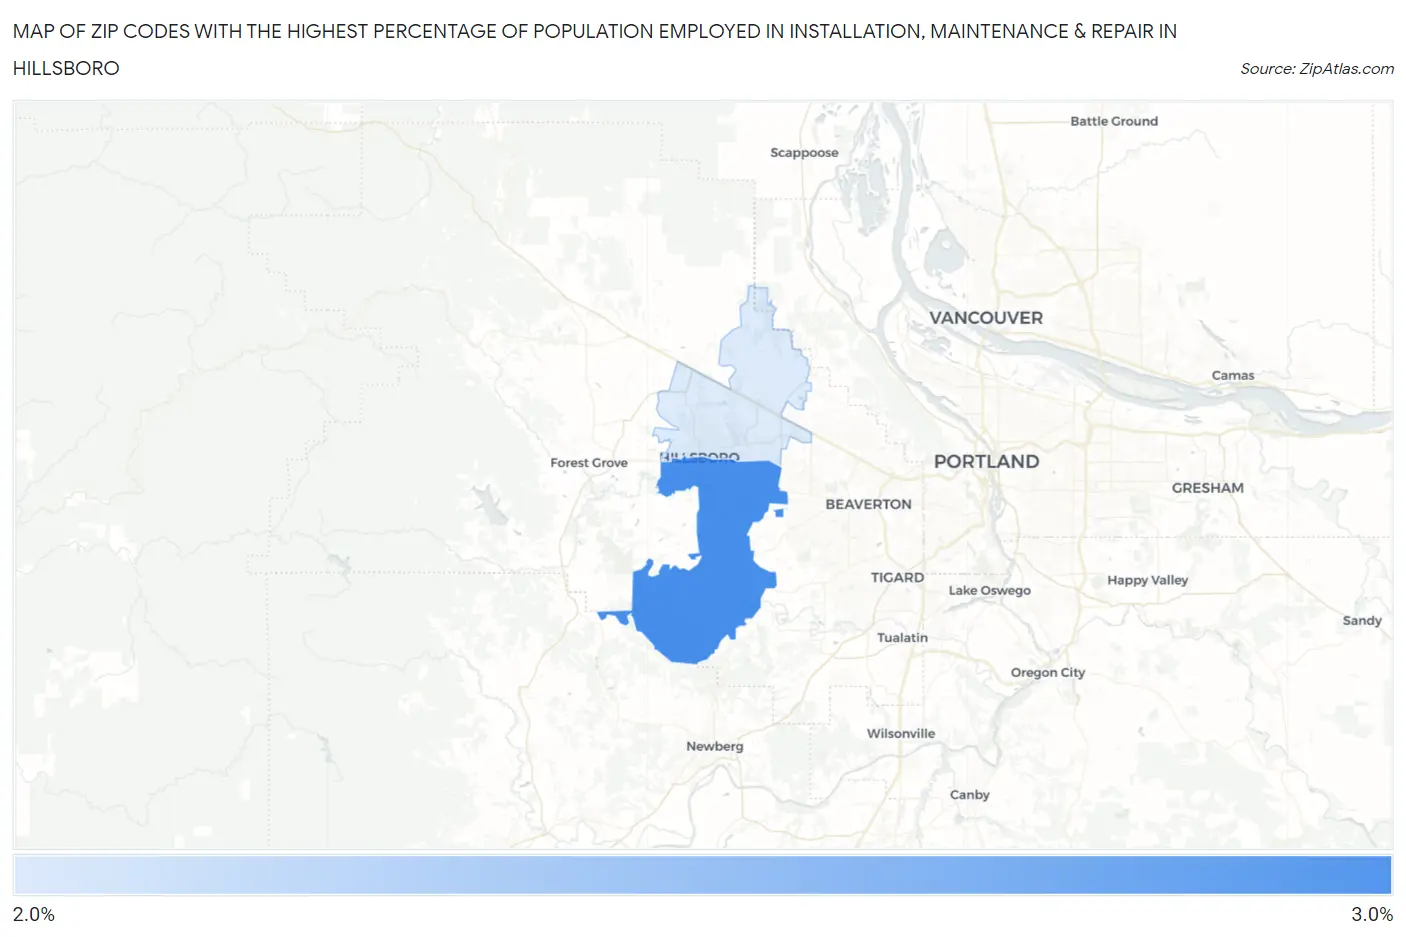
Map of Zip Codes with the Highest Percentage of Population Employed in Installation, Maintenance & Repair in Hillsboro
0.0%
3.0%
Zip Codes with the Highest Percentage of Population Employed in Installation, Maintenance & Repair in Hillsboro, OR
| Zip Code | % Employed | vs State | vs National | |
| 1. | 97123 | 2.9% | 2.7%(+0.158)#182 | 3.1%(-0.196)#17,654 |
| 2. | 97124 | 2.8% | 2.7%(+0.086)#186 | 3.1%(-0.268)#18,007 |
1
Common Questions
What are the Top Zip Codes with the Highest Percentage of Population Employed in Installation, Maintenance & Repair in Hillsboro, OR?
Top Zip Codes with the Highest Percentage of Population Employed in Installation, Maintenance & Repair in Hillsboro, OR are:
What zip code has the Highest Percentage of Population Employed in Installation, Maintenance & Repair in Hillsboro, OR?
97123 has the Highest Percentage of Population Employed in Installation, Maintenance & Repair in Hillsboro, OR with 2.9%.
What is the Percentage of Population Employed in Installation, Maintenance & Repair in Hillsboro, OR?
Percentage of Population Employed in Installation, Maintenance & Repair in Hillsboro is 2.6%.
What is the Percentage of Population Employed in Installation, Maintenance & Repair in Oregon?
Percentage of Population Employed in Installation, Maintenance & Repair in Oregon is 2.7%.
What is the Percentage of Population Employed in Installation, Maintenance & Repair in the United States?
Percentage of Population Employed in Installation, Maintenance & Repair in the United States is 3.1%.