Yuman vs Immigrants from Panama In Labor Force | Age > 16
COMPARE
Yuman
Immigrants from Panama
In Labor Force | Age > 16
In Labor Force | Age > 16 Comparison
Yuman
Immigrants from Panama
57.8%
IN LABOR FORCE | AGE > 16
0.0/ 100
METRIC RATING
343rd/ 347
METRIC RANK
65.1%
IN LABOR FORCE | AGE > 16
42.4/ 100
METRIC RATING
181st/ 347
METRIC RANK
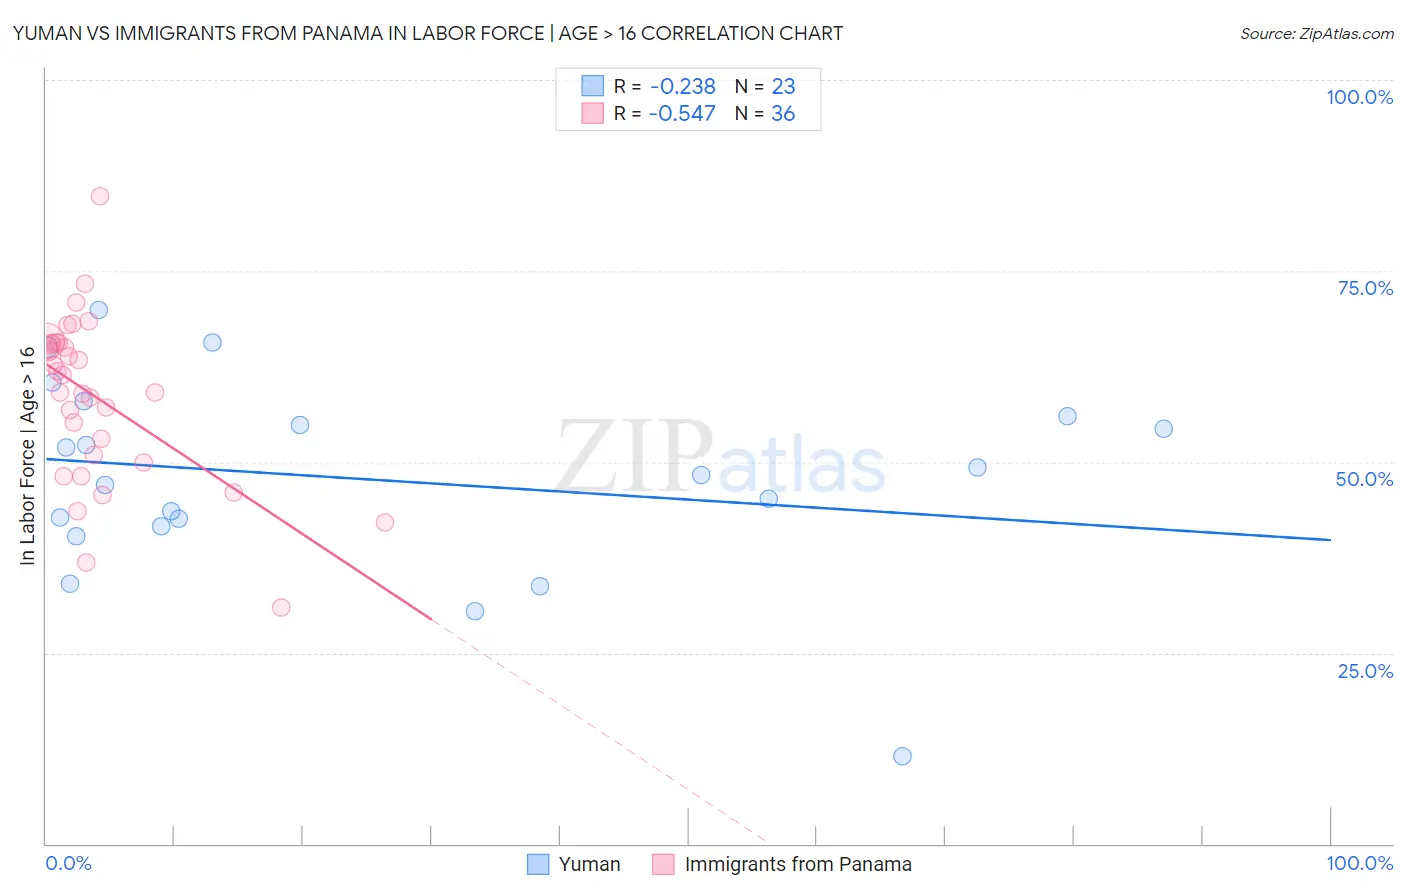
Yuman vs Immigrants from Panama In Labor Force | Age > 16 Correlation Chart
The statistical analysis conducted on geographies consisting of 40,686,052 people shows a weak negative correlation between the proportion of Yuman and labor force participation rate among population ages 16 and over in the United States with a correlation coefficient (R) of -0.238 and weighted average of 57.8%. Similarly, the statistical analysis conducted on geographies consisting of 221,185,422 people shows a substantial negative correlation between the proportion of Immigrants from Panama and labor force participation rate among population ages 16 and over in the United States with a correlation coefficient (R) of -0.547 and weighted average of 65.1%, a difference of 12.6%.
In Labor Force | Age > 16 Correlation Summary
| Measurement | Yuman | Immigrants from Panama |
| Minimum | 11.5% | 31.0% |
| Maximum | 69.9% | 84.7% |
| Range | 58.4% | 53.7% |
| Mean | 47.7% | 58.4% |
| Median | 48.3% | 60.3% |
| Interquartile 25% (IQ1) | 41.5% | 50.4% |
| Interquartile 75% (IQ3) | 55.9% | 65.5% |
| Interquartile Range (IQR) | 14.4% | 15.1% |
| Standard Deviation (Sample) | 13.0% | 10.9% |
| Standard Deviation (Population) | 12.8% | 10.8% |
Similar Demographics by In Labor Force | Age > 16
Demographics Similar to Yuman by In Labor Force | Age > 16
In terms of in labor force | age > 16, the demographic groups most similar to Yuman are Puerto Rican (58.1%, a difference of 0.52%), Pima (57.4%, a difference of 0.70%), Hopi (58.4%, a difference of 0.99%), Tohono O'odham (57.2%, a difference of 0.99%), and Lumbee (56.8%, a difference of 1.8%).
| Demographics | Rating | Rank | In Labor Force | Age > 16 |
| Paiute | 0.0 /100 | #333 | Tragic 60.7% |
| Apache | 0.0 /100 | #334 | Tragic 60.7% |
| Natives/Alaskans | 0.0 /100 | #335 | Tragic 60.6% |
| Menominee | 0.0 /100 | #336 | Tragic 60.6% |
| Colville | 0.0 /100 | #337 | Tragic 59.8% |
| Immigrants | Yemen | 0.0 /100 | #338 | Tragic 59.6% |
| Houma | 0.0 /100 | #339 | Tragic 59.5% |
| Pueblo | 0.0 /100 | #340 | Tragic 59.3% |
| Hopi | 0.0 /100 | #341 | Tragic 58.4% |
| Puerto Ricans | 0.0 /100 | #342 | Tragic 58.1% |
| Yuman | 0.0 /100 | #343 | Tragic 57.8% |
| Pima | 0.0 /100 | #344 | Tragic 57.4% |
| Tohono O'odham | 0.0 /100 | #345 | Tragic 57.2% |
| Lumbee | 0.0 /100 | #346 | Tragic 56.8% |
| Navajo | 0.0 /100 | #347 | Tragic 56.6% |
Demographics Similar to Immigrants from Panama by In Labor Force | Age > 16
In terms of in labor force | age > 16, the demographic groups most similar to Immigrants from Panama are Immigrants from Haiti (65.1%, a difference of 0.010%), Immigrants from Latvia (65.1%, a difference of 0.010%), Immigrants from Nicaragua (65.1%, a difference of 0.020%), Soviet Union (65.0%, a difference of 0.020%), and Trinidadian and Tobagonian (65.1%, a difference of 0.030%).
| Demographics | Rating | Rank | In Labor Force | Age > 16 |
| Macedonians | 50.0 /100 | #174 | Average 65.1% |
| Nicaraguans | 49.7 /100 | #175 | Average 65.1% |
| Swedes | 47.4 /100 | #176 | Average 65.1% |
| Eastern Europeans | 46.2 /100 | #177 | Average 65.1% |
| Trinidadians and Tobagonians | 45.2 /100 | #178 | Average 65.1% |
| Immigrants | Haiti | 43.3 /100 | #179 | Average 65.1% |
| Immigrants | Latvia | 42.9 /100 | #180 | Average 65.1% |
| Immigrants | Panama | 42.4 /100 | #181 | Average 65.1% |
| Immigrants | Nicaragua | 41.1 /100 | #182 | Average 65.1% |
| Soviet Union | 40.5 /100 | #183 | Average 65.0% |
| Carpatho Rusyns | 40.0 /100 | #184 | Average 65.0% |
| Syrians | 40.0 /100 | #185 | Average 65.0% |
| Immigrants | Switzerland | 38.2 /100 | #186 | Fair 65.0% |
| Immigrants | Croatia | 35.7 /100 | #187 | Fair 65.0% |
| Immigrants | Portugal | 34.8 /100 | #188 | Fair 65.0% |