Ute vs Immigrants from Europe In Labor Force | Age 25-29
COMPARE
Ute
Immigrants from Europe
In Labor Force | Age 25-29
In Labor Force | Age 25-29 Comparison
Ute
Immigrants from Europe
80.8%
IN LABOR FORCE | AGE 25-29
0.0/ 100
METRIC RATING
327th/ 347
METRIC RANK
85.2%
IN LABOR FORCE | AGE 25-29
96.8/ 100
METRIC RATING
83rd/ 347
METRIC RANK
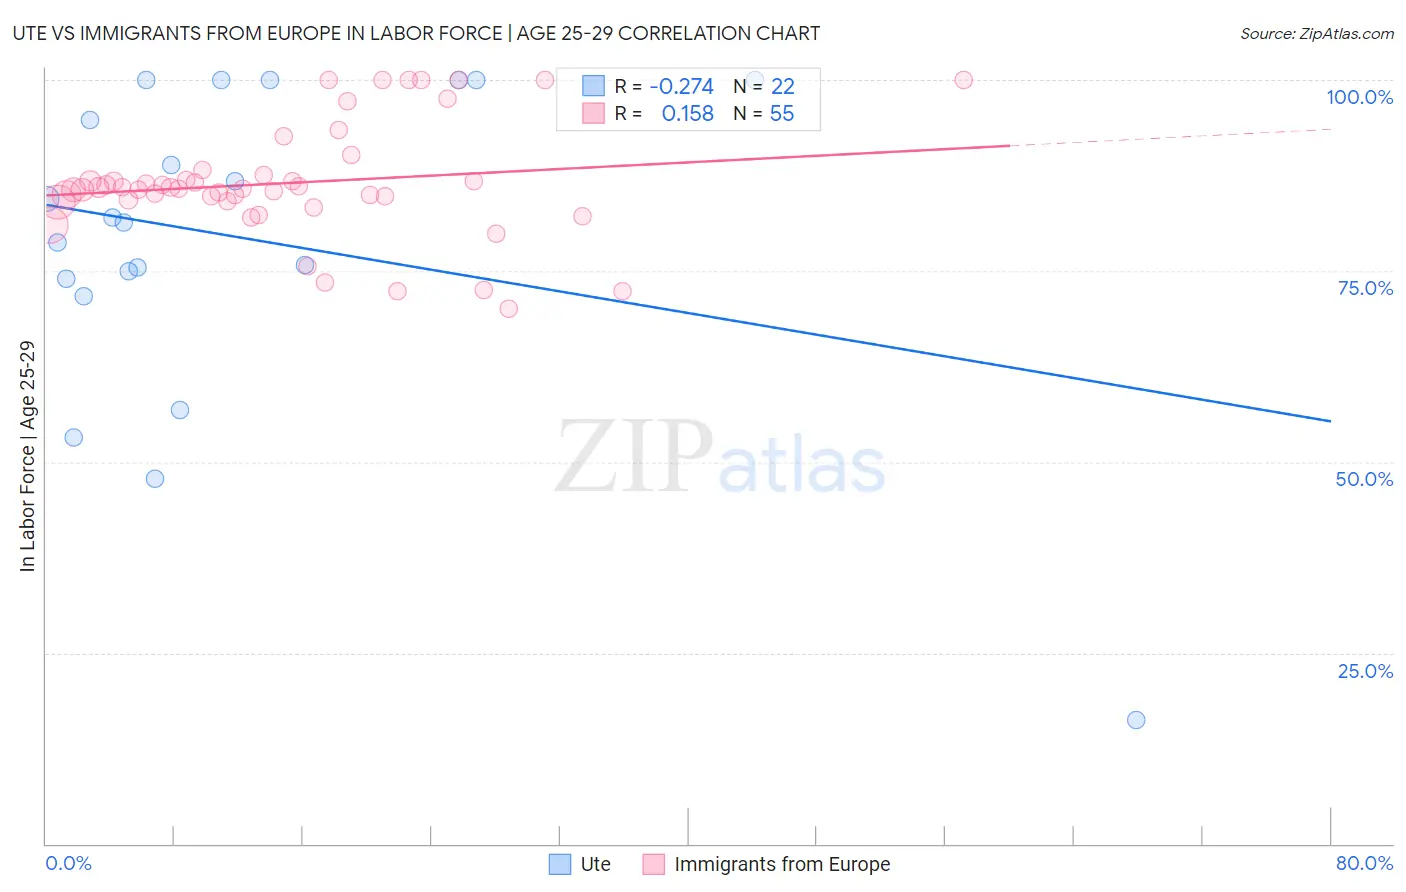
Ute vs Immigrants from Europe In Labor Force | Age 25-29 Correlation Chart
The statistical analysis conducted on geographies consisting of 55,662,248 people shows a weak negative correlation between the proportion of Ute and labor force participation rate among population between the ages 25 and 29 in the United States with a correlation coefficient (R) of -0.274 and weighted average of 80.8%. Similarly, the statistical analysis conducted on geographies consisting of 546,633,730 people shows a poor positive correlation between the proportion of Immigrants from Europe and labor force participation rate among population between the ages 25 and 29 in the United States with a correlation coefficient (R) of 0.158 and weighted average of 85.2%, a difference of 5.4%.
In Labor Force | Age 25-29 Correlation Summary
| Measurement | Ute | Immigrants from Europe |
| Minimum | 16.2% | 70.1% |
| Maximum | 100.0% | 100.0% |
| Range | 83.8% | 29.9% |
| Mean | 79.2% | 86.5% |
| Median | 81.7% | 85.8% |
| Interquartile 25% (IQ1) | 73.9% | 84.1% |
| Interquartile 75% (IQ3) | 100.0% | 87.6% |
| Interquartile Range (IQR) | 26.1% | 3.5% |
| Standard Deviation (Sample) | 21.0% | 7.4% |
| Standard Deviation (Population) | 20.5% | 7.3% |
Similar Demographics by In Labor Force | Age 25-29
Demographics Similar to Ute by In Labor Force | Age 25-29
In terms of in labor force | age 25-29, the demographic groups most similar to Ute are Creek (80.7%, a difference of 0.15%), Choctaw (81.0%, a difference of 0.20%), Yakama (80.6%, a difference of 0.26%), Dutch West Indian (81.1%, a difference of 0.41%), and Puerto Rican (80.4%, a difference of 0.48%).
| Demographics | Rating | Rank | In Labor Force | Age 25-29 |
| Colville | 0.0 /100 | #320 | Tragic 81.6% |
| Shoshone | 0.0 /100 | #321 | Tragic 81.6% |
| Kiowa | 0.0 /100 | #322 | Tragic 81.6% |
| Alaska Natives | 0.0 /100 | #323 | Tragic 81.6% |
| Houma | 0.0 /100 | #324 | Tragic 81.2% |
| Dutch West Indians | 0.0 /100 | #325 | Tragic 81.1% |
| Choctaw | 0.0 /100 | #326 | Tragic 81.0% |
| Ute | 0.0 /100 | #327 | Tragic 80.8% |
| Creek | 0.0 /100 | #328 | Tragic 80.7% |
| Yakama | 0.0 /100 | #329 | Tragic 80.6% |
| Puerto Ricans | 0.0 /100 | #330 | Tragic 80.4% |
| Cheyenne | 0.0 /100 | #331 | Tragic 80.3% |
| Inupiat | 0.0 /100 | #332 | Tragic 79.8% |
| Sioux | 0.0 /100 | #333 | Tragic 79.7% |
| Yuman | 0.0 /100 | #334 | Tragic 79.3% |
Demographics Similar to Immigrants from Europe by In Labor Force | Age 25-29
In terms of in labor force | age 25-29, the demographic groups most similar to Immigrants from Europe are Immigrants from Eastern Europe (85.2%, a difference of 0.0%), Okinawan (85.2%, a difference of 0.010%), Immigrants from Africa (85.2%, a difference of 0.010%), Ukrainian (85.2%, a difference of 0.010%), and French Canadian (85.2%, a difference of 0.020%).
| Demographics | Rating | Rank | In Labor Force | Age 25-29 |
| Germans | 98.1 /100 | #76 | Exceptional 85.3% |
| Immigrants | South Central Asia | 97.9 /100 | #77 | Exceptional 85.2% |
| Immigrants | Egypt | 97.7 /100 | #78 | Exceptional 85.2% |
| Immigrants | Northern Africa | 97.6 /100 | #79 | Exceptional 85.2% |
| Immigrants | Zimbabwe | 97.6 /100 | #80 | Exceptional 85.2% |
| Immigrants | Northern Europe | 97.2 /100 | #81 | Exceptional 85.2% |
| Okinawans | 97.0 /100 | #82 | Exceptional 85.2% |
| Immigrants | Europe | 96.8 /100 | #83 | Exceptional 85.2% |
| Immigrants | Eastern Europe | 96.8 /100 | #84 | Exceptional 85.2% |
| Immigrants | Africa | 96.7 /100 | #85 | Exceptional 85.2% |
| Ukrainians | 96.7 /100 | #86 | Exceptional 85.2% |
| French Canadians | 96.5 /100 | #87 | Exceptional 85.2% |
| Immigrants | Croatia | 96.4 /100 | #88 | Exceptional 85.2% |
| Immigrants | France | 96.3 /100 | #89 | Exceptional 85.2% |
| Burmese | 95.9 /100 | #90 | Exceptional 85.1% |