Uruguayan vs European In Labor Force | Age 35-44
COMPARE
Uruguayan
European
In Labor Force | Age 35-44
In Labor Force | Age 35-44 Comparison
Uruguayans
Europeans
84.7%
IN LABOR FORCE | AGE 35-44
93.3/ 100
METRIC RATING
113th/ 347
METRIC RANK
84.1%
IN LABOR FORCE | AGE 35-44
12.2/ 100
METRIC RATING
215th/ 347
METRIC RANK
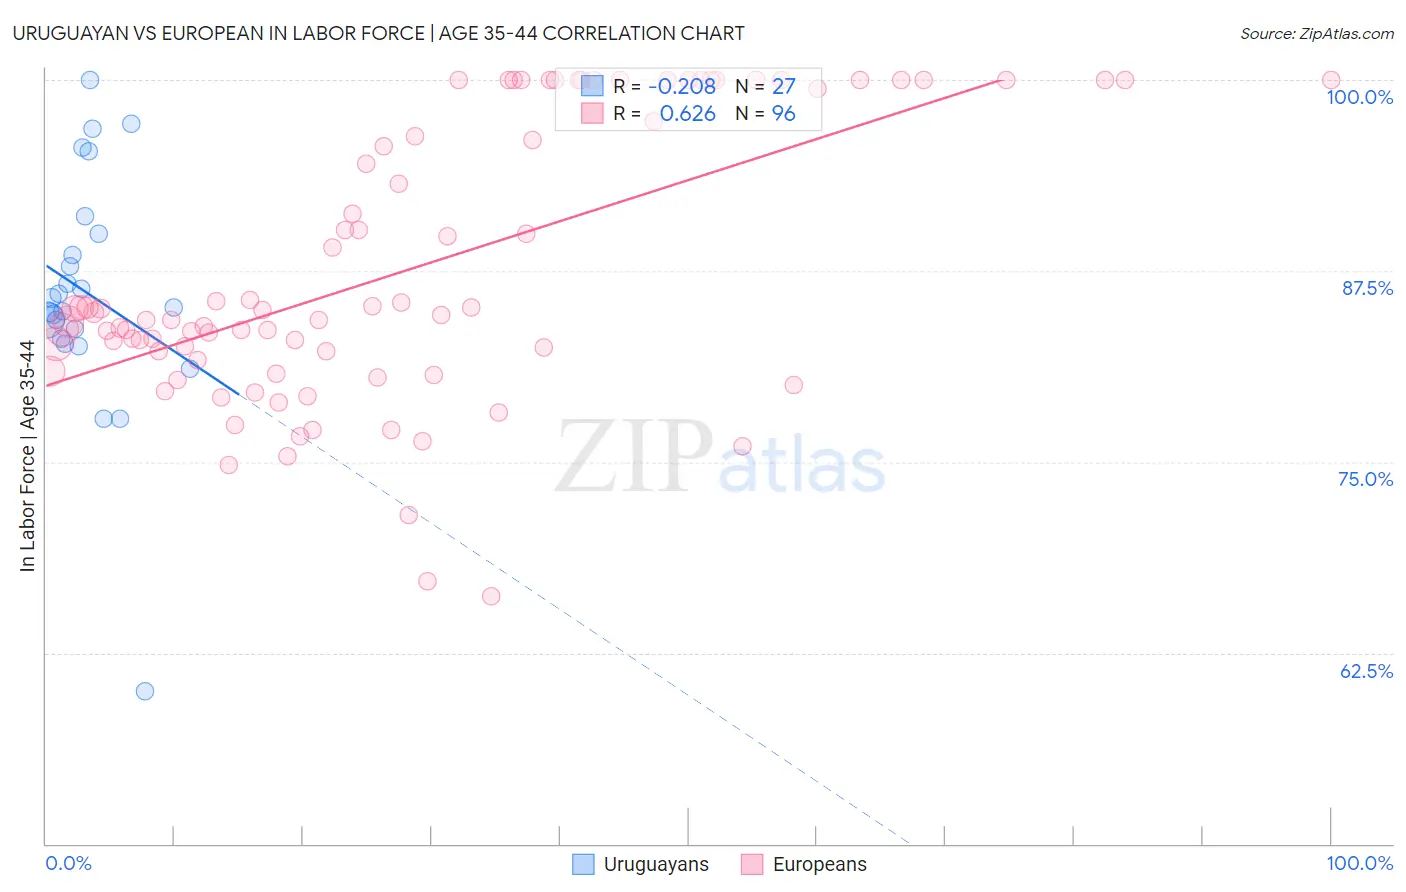
Uruguayan vs European In Labor Force | Age 35-44 Correlation Chart
The statistical analysis conducted on geographies consisting of 144,759,771 people shows a weak negative correlation between the proportion of Uruguayans and labor force participation rate among population between the ages 35 and 44 in the United States with a correlation coefficient (R) of -0.208 and weighted average of 84.7%. Similarly, the statistical analysis conducted on geographies consisting of 561,223,760 people shows a significant positive correlation between the proportion of Europeans and labor force participation rate among population between the ages 35 and 44 in the United States with a correlation coefficient (R) of 0.626 and weighted average of 84.1%, a difference of 0.75%.
In Labor Force | Age 35-44 Correlation Summary
| Measurement | Uruguayan | European |
| Minimum | 60.0% | 66.2% |
| Maximum | 100.0% | 100.0% |
| Range | 40.0% | 33.8% |
| Mean | 86.1% | 87.6% |
| Median | 85.1% | 84.7% |
| Interquartile 25% (IQ1) | 83.0% | 81.9% |
| Interquartile 75% (IQ3) | 90.0% | 99.7% |
| Interquartile Range (IQR) | 7.0% | 17.8% |
| Standard Deviation (Sample) | 7.7% | 9.0% |
| Standard Deviation (Population) | 7.6% | 8.9% |
Similar Demographics by In Labor Force | Age 35-44
Demographics Similar to Uruguayans by In Labor Force | Age 35-44
In terms of in labor force | age 35-44, the demographic groups most similar to Uruguayans are Immigrants from Western Africa (84.7%, a difference of 0.0%), Chilean (84.7%, a difference of 0.0%), Bahamian (84.7%, a difference of 0.0%), Filipino (84.7%, a difference of 0.010%), and Ukrainian (84.7%, a difference of 0.010%).
| Demographics | Rating | Rank | In Labor Force | Age 35-44 |
| Immigrants | Bahamas | 94.8 /100 | #106 | Exceptional 84.8% |
| Immigrants | Romania | 94.7 /100 | #107 | Exceptional 84.8% |
| Immigrants | Argentina | 94.5 /100 | #108 | Exceptional 84.8% |
| Immigrants | Russia | 94.5 /100 | #109 | Exceptional 84.8% |
| Filipinos | 93.8 /100 | #110 | Exceptional 84.7% |
| Ukrainians | 93.5 /100 | #111 | Exceptional 84.7% |
| Immigrants | Western Africa | 93.4 /100 | #112 | Exceptional 84.7% |
| Uruguayans | 93.3 /100 | #113 | Exceptional 84.7% |
| Chileans | 93.2 /100 | #114 | Exceptional 84.7% |
| Bahamians | 93.2 /100 | #115 | Exceptional 84.7% |
| Immigrants | Egypt | 92.7 /100 | #116 | Exceptional 84.7% |
| Immigrants | China | 92.3 /100 | #117 | Exceptional 84.7% |
| Immigrants | Eastern Asia | 92.1 /100 | #118 | Exceptional 84.7% |
| Burmese | 91.8 /100 | #119 | Exceptional 84.7% |
| Immigrants | Northern Europe | 91.5 /100 | #120 | Exceptional 84.7% |
Demographics Similar to Europeans by In Labor Force | Age 35-44
In terms of in labor force | age 35-44, the demographic groups most similar to Europeans are Nicaraguan (84.1%, a difference of 0.0%), Immigrants from Barbados (84.1%, a difference of 0.010%), Immigrants from Norway (84.1%, a difference of 0.010%), Bangladeshi (84.1%, a difference of 0.020%), and Israeli (84.1%, a difference of 0.030%).
| Demographics | Rating | Rank | In Labor Force | Age 35-44 |
| Immigrants | North America | 18.1 /100 | #208 | Poor 84.2% |
| Swiss | 17.4 /100 | #209 | Poor 84.2% |
| New Zealanders | 16.2 /100 | #210 | Poor 84.1% |
| Immigrants | Ecuador | 15.2 /100 | #211 | Poor 84.1% |
| Israelis | 14.0 /100 | #212 | Poor 84.1% |
| Bangladeshis | 13.7 /100 | #213 | Poor 84.1% |
| Immigrants | Barbados | 13.2 /100 | #214 | Poor 84.1% |
| Europeans | 12.2 /100 | #215 | Poor 84.1% |
| Nicaraguans | 12.1 /100 | #216 | Poor 84.1% |
| Immigrants | Norway | 11.7 /100 | #217 | Poor 84.1% |
| Immigrants | Nicaragua | 9.4 /100 | #218 | Tragic 84.1% |
| Sub-Saharan Africans | 9.3 /100 | #219 | Tragic 84.1% |
| French | 7.5 /100 | #220 | Tragic 84.0% |
| Icelanders | 6.7 /100 | #221 | Tragic 84.0% |
| Assyrians/Chaldeans/Syriacs | 6.6 /100 | #222 | Tragic 84.0% |