Spanish American Indian vs Haitian In Labor Force | Age > 16
COMPARE
Spanish American Indian
Haitian
In Labor Force | Age > 16
In Labor Force | Age > 16 Comparison
Spanish American Indians
Haitians
63.8%
IN LABOR FORCE | AGE > 16
0.1/ 100
METRIC RATING
292nd/ 347
METRIC RANK
65.0%
IN LABOR FORCE | AGE > 16
30.6/ 100
METRIC RATING
196th/ 347
METRIC RANK
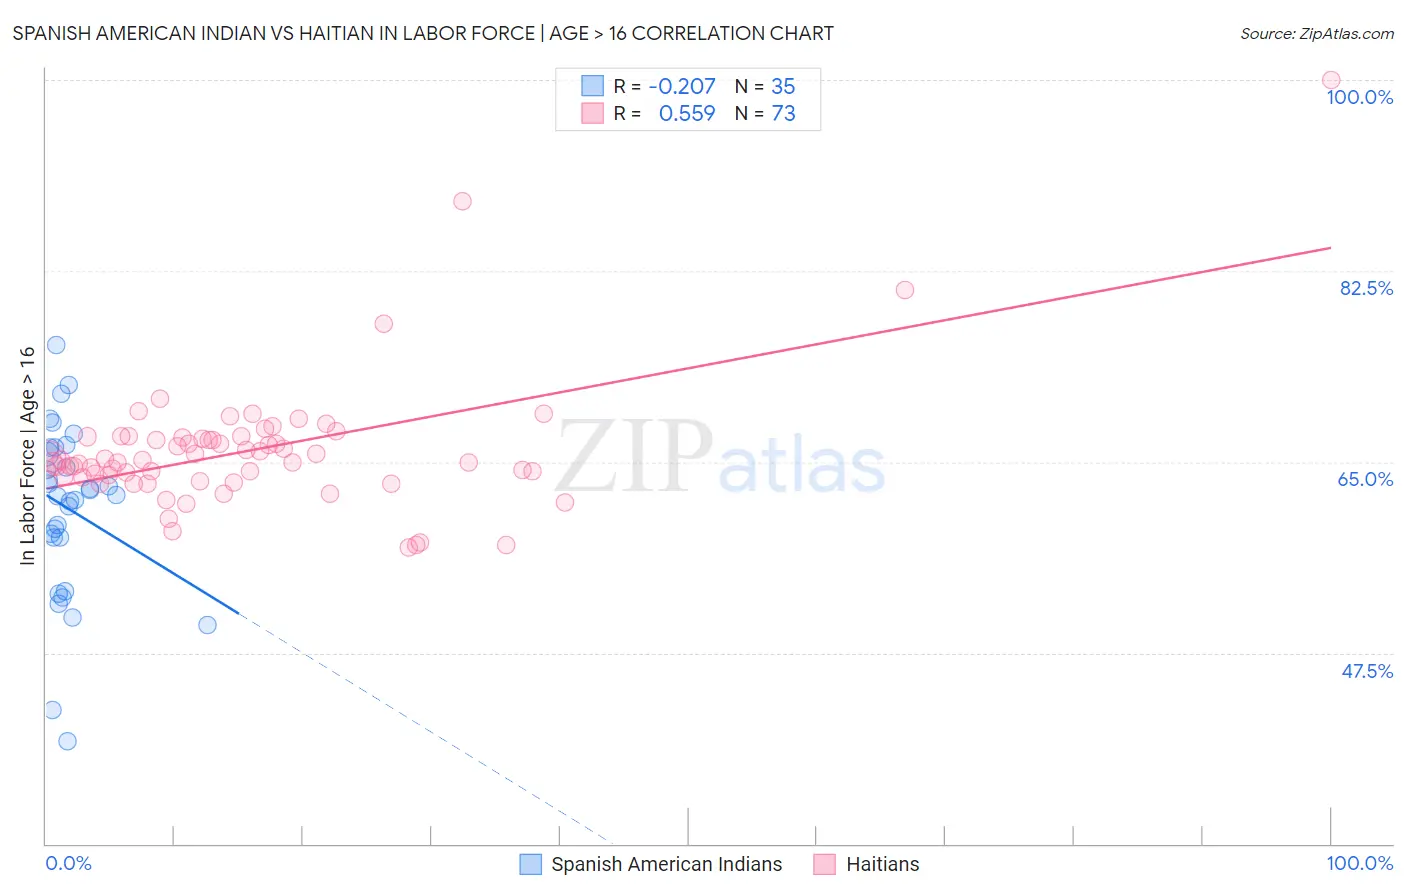
Spanish American Indian vs Haitian In Labor Force | Age > 16 Correlation Chart
The statistical analysis conducted on geographies consisting of 73,150,359 people shows a weak negative correlation between the proportion of Spanish American Indians and labor force participation rate among population ages 16 and over in the United States with a correlation coefficient (R) of -0.207 and weighted average of 63.8%. Similarly, the statistical analysis conducted on geographies consisting of 288,007,130 people shows a substantial positive correlation between the proportion of Haitians and labor force participation rate among population ages 16 and over in the United States with a correlation coefficient (R) of 0.559 and weighted average of 65.0%, a difference of 1.9%.
In Labor Force | Age > 16 Correlation Summary
| Measurement | Spanish American Indian | Haitian |
| Minimum | 39.4% | 57.2% |
| Maximum | 75.7% | 100.0% |
| Range | 36.3% | 42.8% |
| Mean | 60.7% | 66.1% |
| Median | 62.0% | 65.1% |
| Interquartile 25% (IQ1) | 58.1% | 63.6% |
| Interquartile 75% (IQ3) | 66.3% | 67.3% |
| Interquartile Range (IQR) | 8.2% | 3.6% |
| Standard Deviation (Sample) | 7.9% | 6.2% |
| Standard Deviation (Population) | 7.8% | 6.1% |
Similar Demographics by In Labor Force | Age > 16
Demographics Similar to Spanish American Indians by In Labor Force | Age > 16
In terms of in labor force | age > 16, the demographic groups most similar to Spanish American Indians are English (63.7%, a difference of 0.040%), Nepalese (63.8%, a difference of 0.060%), Hungarian (63.8%, a difference of 0.070%), Puget Sound Salish (63.7%, a difference of 0.070%), and Celtic (63.8%, a difference of 0.10%).
| Demographics | Rating | Rank | In Labor Force | Age > 16 |
| Slovaks | 0.1 /100 | #285 | Tragic 63.9% |
| Immigrants | Austria | 0.1 /100 | #286 | Tragic 63.9% |
| Scottish | 0.1 /100 | #287 | Tragic 63.9% |
| Spanish | 0.1 /100 | #288 | Tragic 63.9% |
| Celtics | 0.1 /100 | #289 | Tragic 63.8% |
| Hungarians | 0.1 /100 | #290 | Tragic 63.8% |
| Nepalese | 0.1 /100 | #291 | Tragic 63.8% |
| Spanish American Indians | 0.1 /100 | #292 | Tragic 63.8% |
| English | 0.1 /100 | #293 | Tragic 63.7% |
| Puget Sound Salish | 0.0 /100 | #294 | Tragic 63.7% |
| Immigrants | Canada | 0.0 /100 | #295 | Tragic 63.7% |
| Immigrants | North America | 0.0 /100 | #296 | Tragic 63.7% |
| Immigrants | Grenada | 0.0 /100 | #297 | Tragic 63.6% |
| Comanche | 0.0 /100 | #298 | Tragic 63.6% |
| Whites/Caucasians | 0.0 /100 | #299 | Tragic 63.6% |
Demographics Similar to Haitians by In Labor Force | Age > 16
In terms of in labor force | age > 16, the demographic groups most similar to Haitians are Immigrants from Southern Europe (65.0%, a difference of 0.010%), Romanian (65.0%, a difference of 0.010%), Immigrants from Italy (65.0%, a difference of 0.030%), Barbadian (65.0%, a difference of 0.040%), and Scandinavian (65.0%, a difference of 0.040%).
| Demographics | Rating | Rank | In Labor Force | Age > 16 |
| Immigrants | Greece | 34.3 /100 | #189 | Fair 65.0% |
| Barbadians | 33.9 /100 | #190 | Fair 65.0% |
| Scandinavians | 33.7 /100 | #191 | Fair 65.0% |
| Immigrants | Fiji | 33.7 /100 | #192 | Fair 65.0% |
| Immigrants | Europe | 33.6 /100 | #193 | Fair 65.0% |
| Immigrants | Southern Europe | 31.3 /100 | #194 | Fair 65.0% |
| Romanians | 31.1 /100 | #195 | Fair 65.0% |
| Haitians | 30.6 /100 | #196 | Fair 65.0% |
| Immigrants | Italy | 28.7 /100 | #197 | Fair 65.0% |
| Greeks | 26.1 /100 | #198 | Fair 64.9% |
| Mexican American Indians | 23.1 /100 | #199 | Fair 64.9% |
| Armenians | 20.2 /100 | #200 | Fair 64.9% |
| Ukrainians | 19.6 /100 | #201 | Poor 64.9% |
| Immigrants | Belgium | 19.4 /100 | #202 | Poor 64.9% |
| Russians | 18.8 /100 | #203 | Poor 64.9% |