Bulgarian vs Haitian In Labor Force | Age > 16
COMPARE
Bulgarian
Haitian
In Labor Force | Age > 16
In Labor Force | Age > 16 Comparison
Bulgarians
Haitians
66.4%
IN LABOR FORCE | AGE > 16
99.9/ 100
METRIC RATING
57th/ 347
METRIC RANK
65.0%
IN LABOR FORCE | AGE > 16
30.6/ 100
METRIC RATING
196th/ 347
METRIC RANK
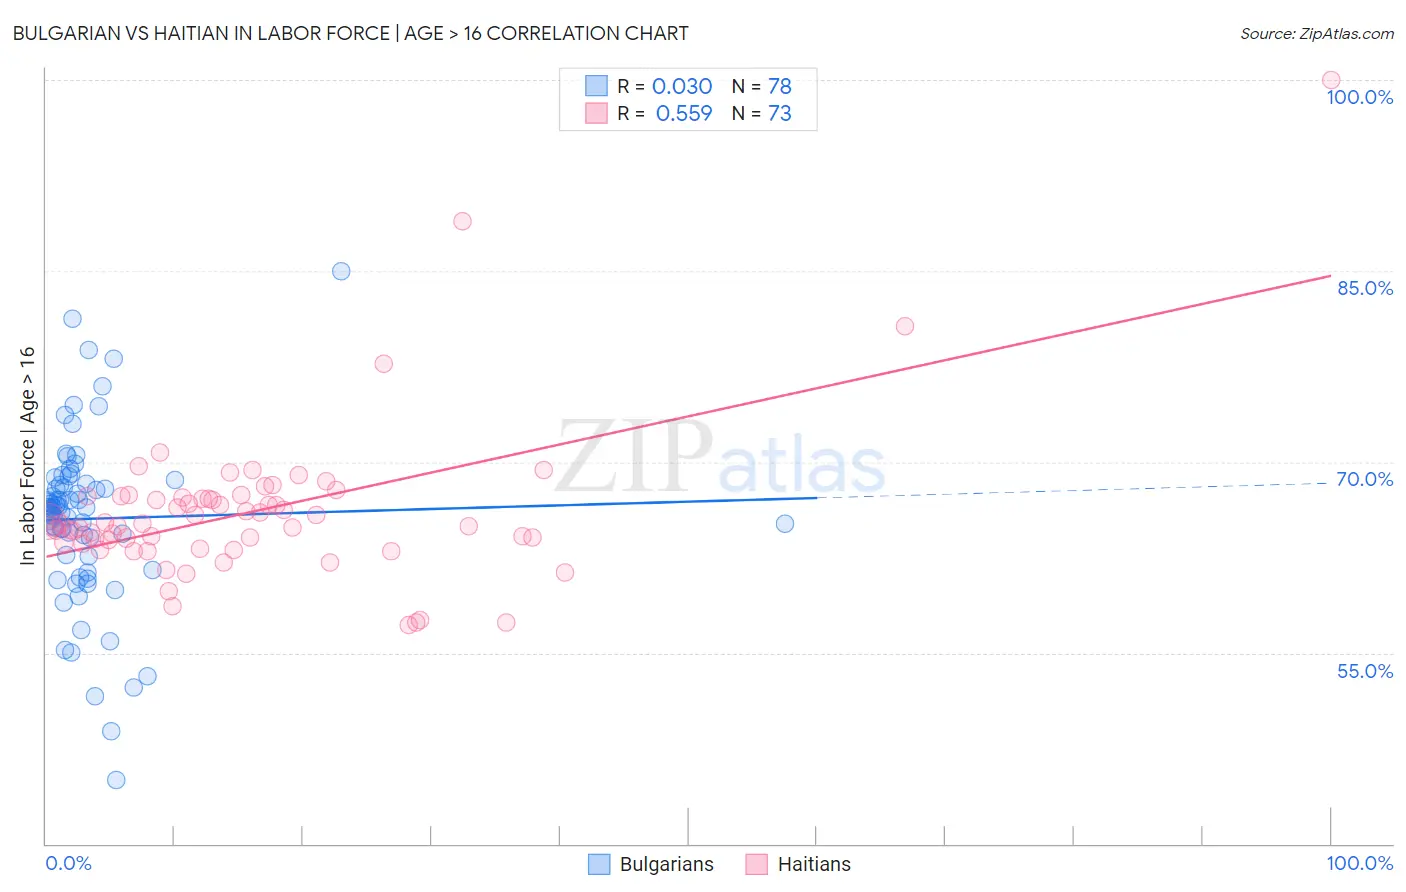
Bulgarian vs Haitian In Labor Force | Age > 16 Correlation Chart
The statistical analysis conducted on geographies consisting of 205,629,160 people shows no correlation between the proportion of Bulgarians and labor force participation rate among population ages 16 and over in the United States with a correlation coefficient (R) of 0.030 and weighted average of 66.4%. Similarly, the statistical analysis conducted on geographies consisting of 288,007,130 people shows a substantial positive correlation between the proportion of Haitians and labor force participation rate among population ages 16 and over in the United States with a correlation coefficient (R) of 0.559 and weighted average of 65.0%, a difference of 2.2%.
In Labor Force | Age > 16 Correlation Summary
| Measurement | Bulgarian | Haitian |
| Minimum | 45.0% | 57.2% |
| Maximum | 85.0% | 100.0% |
| Range | 40.0% | 42.8% |
| Mean | 65.5% | 66.1% |
| Median | 66.4% | 65.1% |
| Interquartile 25% (IQ1) | 62.6% | 63.6% |
| Interquartile 75% (IQ3) | 68.2% | 67.3% |
| Interquartile Range (IQR) | 5.6% | 3.6% |
| Standard Deviation (Sample) | 6.7% | 6.2% |
| Standard Deviation (Population) | 6.7% | 6.1% |
Similar Demographics by In Labor Force | Age > 16
Demographics Similar to Bulgarians by In Labor Force | Age > 16
In terms of in labor force | age > 16, the demographic groups most similar to Bulgarians are Immigrants from Senegal (66.4%, a difference of 0.010%), Immigrants from Venezuela (66.4%, a difference of 0.040%), Immigrants from Bosnia and Herzegovina (66.5%, a difference of 0.090%), Immigrants from Saudi Arabia (66.3%, a difference of 0.10%), and Immigrants from Sri Lanka (66.5%, a difference of 0.12%).
| Demographics | Rating | Rank | In Labor Force | Age > 16 |
| Cape Verdeans | 100.0 /100 | #50 | Exceptional 66.6% |
| Immigrants | Kuwait | 100.0 /100 | #51 | Exceptional 66.5% |
| Paraguayans | 99.9 /100 | #52 | Exceptional 66.5% |
| Immigrants | Sri Lanka | 99.9 /100 | #53 | Exceptional 66.5% |
| Immigrants | Bosnia and Herzegovina | 99.9 /100 | #54 | Exceptional 66.5% |
| Immigrants | Venezuela | 99.9 /100 | #55 | Exceptional 66.4% |
| Immigrants | Senegal | 99.9 /100 | #56 | Exceptional 66.4% |
| Bulgarians | 99.9 /100 | #57 | Exceptional 66.4% |
| Immigrants | Saudi Arabia | 99.9 /100 | #58 | Exceptional 66.3% |
| Immigrants | Turkey | 99.9 /100 | #59 | Exceptional 66.3% |
| Immigrants | Peru | 99.8 /100 | #60 | Exceptional 66.3% |
| Immigrants | Burma/Myanmar | 99.8 /100 | #61 | Exceptional 66.3% |
| Indonesians | 99.8 /100 | #62 | Exceptional 66.3% |
| Venezuelans | 99.8 /100 | #63 | Exceptional 66.3% |
| Peruvians | 99.8 /100 | #64 | Exceptional 66.3% |
Demographics Similar to Haitians by In Labor Force | Age > 16
In terms of in labor force | age > 16, the demographic groups most similar to Haitians are Immigrants from Southern Europe (65.0%, a difference of 0.010%), Romanian (65.0%, a difference of 0.010%), Immigrants from Italy (65.0%, a difference of 0.030%), Barbadian (65.0%, a difference of 0.040%), and Scandinavian (65.0%, a difference of 0.040%).
| Demographics | Rating | Rank | In Labor Force | Age > 16 |
| Immigrants | Greece | 34.3 /100 | #189 | Fair 65.0% |
| Barbadians | 33.9 /100 | #190 | Fair 65.0% |
| Scandinavians | 33.7 /100 | #191 | Fair 65.0% |
| Immigrants | Fiji | 33.7 /100 | #192 | Fair 65.0% |
| Immigrants | Europe | 33.6 /100 | #193 | Fair 65.0% |
| Immigrants | Southern Europe | 31.3 /100 | #194 | Fair 65.0% |
| Romanians | 31.1 /100 | #195 | Fair 65.0% |
| Haitians | 30.6 /100 | #196 | Fair 65.0% |
| Immigrants | Italy | 28.7 /100 | #197 | Fair 65.0% |
| Greeks | 26.1 /100 | #198 | Fair 64.9% |
| Mexican American Indians | 23.1 /100 | #199 | Fair 64.9% |
| Armenians | 20.2 /100 | #200 | Fair 64.9% |
| Ukrainians | 19.6 /100 | #201 | Poor 64.9% |
| Immigrants | Belgium | 19.4 /100 | #202 | Poor 64.9% |
| Russians | 18.8 /100 | #203 | Poor 64.9% |