Soviet Union vs Immigrants from South Eastern Asia In Labor Force | Age 45-54
COMPARE
Soviet Union
Immigrants from South Eastern Asia
In Labor Force | Age 45-54
In Labor Force | Age 45-54 Comparison
Soviet Union
Immigrants from South Eastern Asia
83.0%
IN LABOR FORCE | AGE 45-54
76.8/ 100
METRIC RATING
144th/ 347
METRIC RANK
82.8%
IN LABOR FORCE | AGE 45-54
57.4/ 100
METRIC RATING
166th/ 347
METRIC RANK
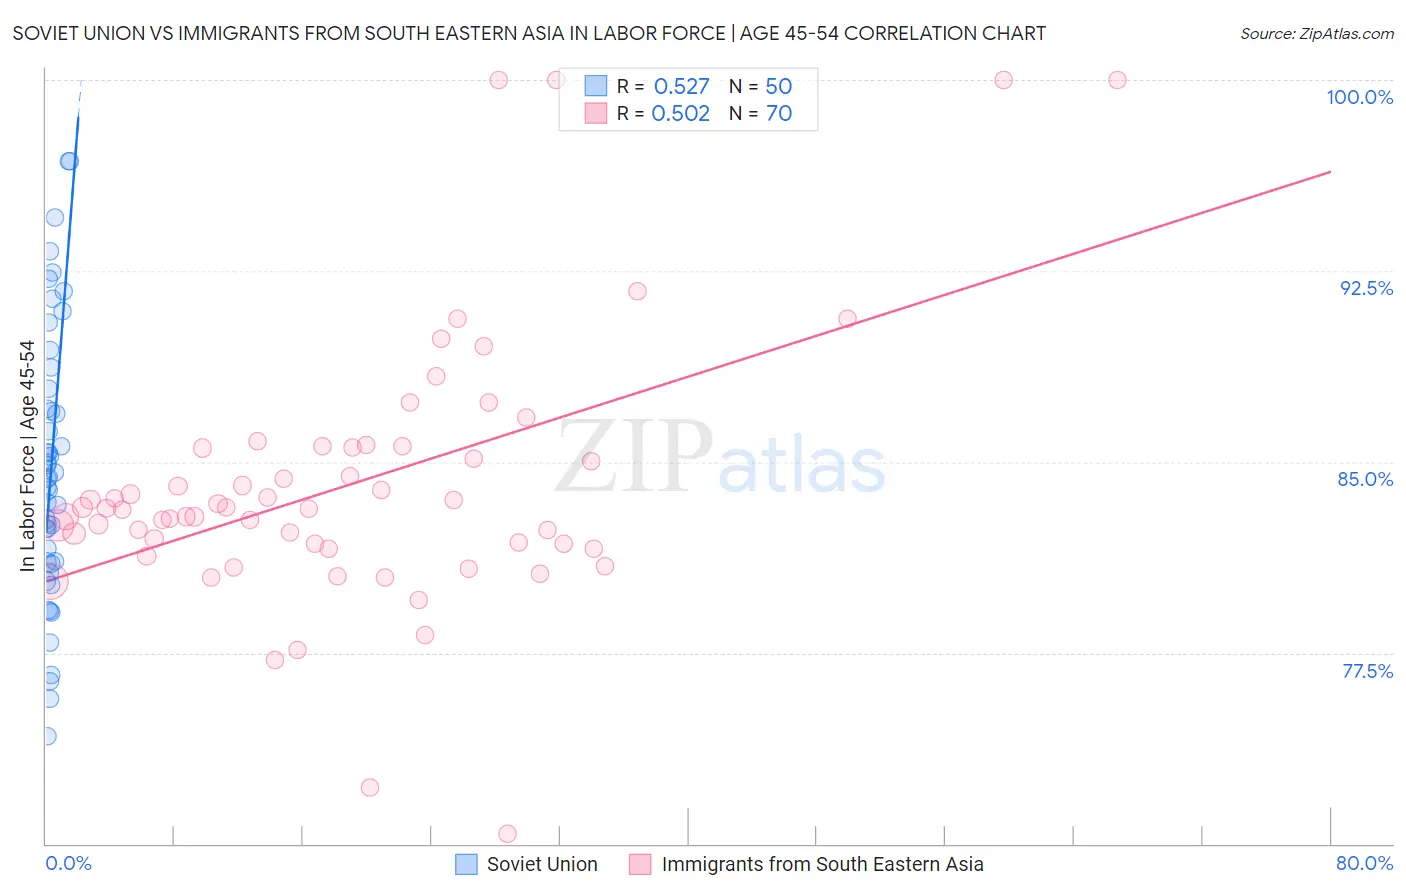
Soviet Union vs Immigrants from South Eastern Asia In Labor Force | Age 45-54 Correlation Chart
The statistical analysis conducted on geographies consisting of 43,509,630 people shows a substantial positive correlation between the proportion of Soviet Union and labor force participation rate among population between the ages 45 and 54 in the United States with a correlation coefficient (R) of 0.527 and weighted average of 83.0%. Similarly, the statistical analysis conducted on geographies consisting of 512,202,899 people shows a substantial positive correlation between the proportion of Immigrants from South Eastern Asia and labor force participation rate among population between the ages 45 and 54 in the United States with a correlation coefficient (R) of 0.502 and weighted average of 82.8%, a difference of 0.20%.
In Labor Force | Age 45-54 Correlation Summary
| Measurement | Soviet Union | Immigrants from South Eastern Asia |
| Minimum | 74.2% | 70.4% |
| Maximum | 96.8% | 100.0% |
| Range | 22.6% | 29.6% |
| Mean | 84.8% | 84.1% |
| Median | 84.4% | 83.2% |
| Interquartile 25% (IQ1) | 81.1% | 81.8% |
| Interquartile 75% (IQ3) | 87.9% | 85.5% |
| Interquartile Range (IQR) | 6.8% | 3.8% |
| Standard Deviation (Sample) | 5.4% | 5.3% |
| Standard Deviation (Population) | 5.3% | 5.2% |
Similar Demographics by In Labor Force | Age 45-54
Demographics Similar to Soviet Union by In Labor Force | Age 45-54
In terms of in labor force | age 45-54, the demographic groups most similar to Soviet Union are Okinawan (83.0%, a difference of 0.0%), Immigrants from Haiti (83.0%, a difference of 0.010%), Immigrants from Scotland (83.0%, a difference of 0.010%), Scandinavian (83.0%, a difference of 0.020%), and Yugoslavian (83.0%, a difference of 0.020%).
| Demographics | Rating | Rank | In Labor Force | Age 45-54 |
| Immigrants | Spain | 80.4 /100 | #137 | Excellent 83.0% |
| Ghanaians | 79.5 /100 | #138 | Good 83.0% |
| Scandinavians | 78.5 /100 | #139 | Good 83.0% |
| Yugoslavians | 78.3 /100 | #140 | Good 83.0% |
| Immigrants | Haiti | 77.9 /100 | #141 | Good 83.0% |
| Immigrants | Scotland | 77.8 /100 | #142 | Good 83.0% |
| Okinawans | 77.0 /100 | #143 | Good 83.0% |
| Soviet Union | 76.8 /100 | #144 | Good 83.0% |
| Romanians | 75.4 /100 | #145 | Good 83.0% |
| Immigrants | France | 75.3 /100 | #146 | Good 83.0% |
| Czechoslovakians | 74.8 /100 | #147 | Good 83.0% |
| Immigrants | Nigeria | 74.1 /100 | #148 | Good 83.0% |
| Immigrants | Sweden | 73.3 /100 | #149 | Good 82.9% |
| Immigrants | Netherlands | 72.6 /100 | #150 | Good 82.9% |
| Koreans | 71.9 /100 | #151 | Good 82.9% |
Demographics Similar to Immigrants from South Eastern Asia by In Labor Force | Age 45-54
In terms of in labor force | age 45-54, the demographic groups most similar to Immigrants from South Eastern Asia are Swiss (82.8%, a difference of 0.010%), Immigrants from South Africa (82.8%, a difference of 0.010%), Immigrants from Sudan (82.8%, a difference of 0.020%), Immigrants from Western Africa (82.8%, a difference of 0.030%), and South American Indian (82.9%, a difference of 0.040%).
| Demographics | Rating | Rank | In Labor Force | Age 45-54 |
| Immigrants | Austria | 64.6 /100 | #159 | Good 82.9% |
| Laotians | 62.8 /100 | #160 | Good 82.9% |
| South American Indians | 62.2 /100 | #161 | Good 82.9% |
| Haitians | 61.8 /100 | #162 | Good 82.8% |
| Dutch | 61.7 /100 | #163 | Good 82.8% |
| German Russians | 61.3 /100 | #164 | Good 82.8% |
| Immigrants | Sudan | 59.9 /100 | #165 | Average 82.8% |
| Immigrants | South Eastern Asia | 57.4 /100 | #166 | Average 82.8% |
| Swiss | 56.5 /100 | #167 | Average 82.8% |
| Immigrants | South Africa | 55.8 /100 | #168 | Average 82.8% |
| Immigrants | Western Africa | 54.1 /100 | #169 | Average 82.8% |
| Pakistanis | 53.2 /100 | #170 | Average 82.8% |
| Immigrants | Zaire | 52.9 /100 | #171 | Average 82.8% |
| Icelanders | 51.8 /100 | #172 | Average 82.8% |
| Nicaraguans | 50.3 /100 | #173 | Average 82.8% |