Scottish vs Filipino In Labor Force | Age 30-34
COMPARE
Scottish
Filipino
In Labor Force | Age 30-34
In Labor Force | Age 30-34 Comparison
Scottish
Filipinos
84.2%
IN LABOR FORCE | AGE 30-34
3.1/ 100
METRIC RATING
225th/ 347
METRIC RANK
85.5%
IN LABOR FORCE | AGE 30-34
99.6/ 100
METRIC RATING
53rd/ 347
METRIC RANK
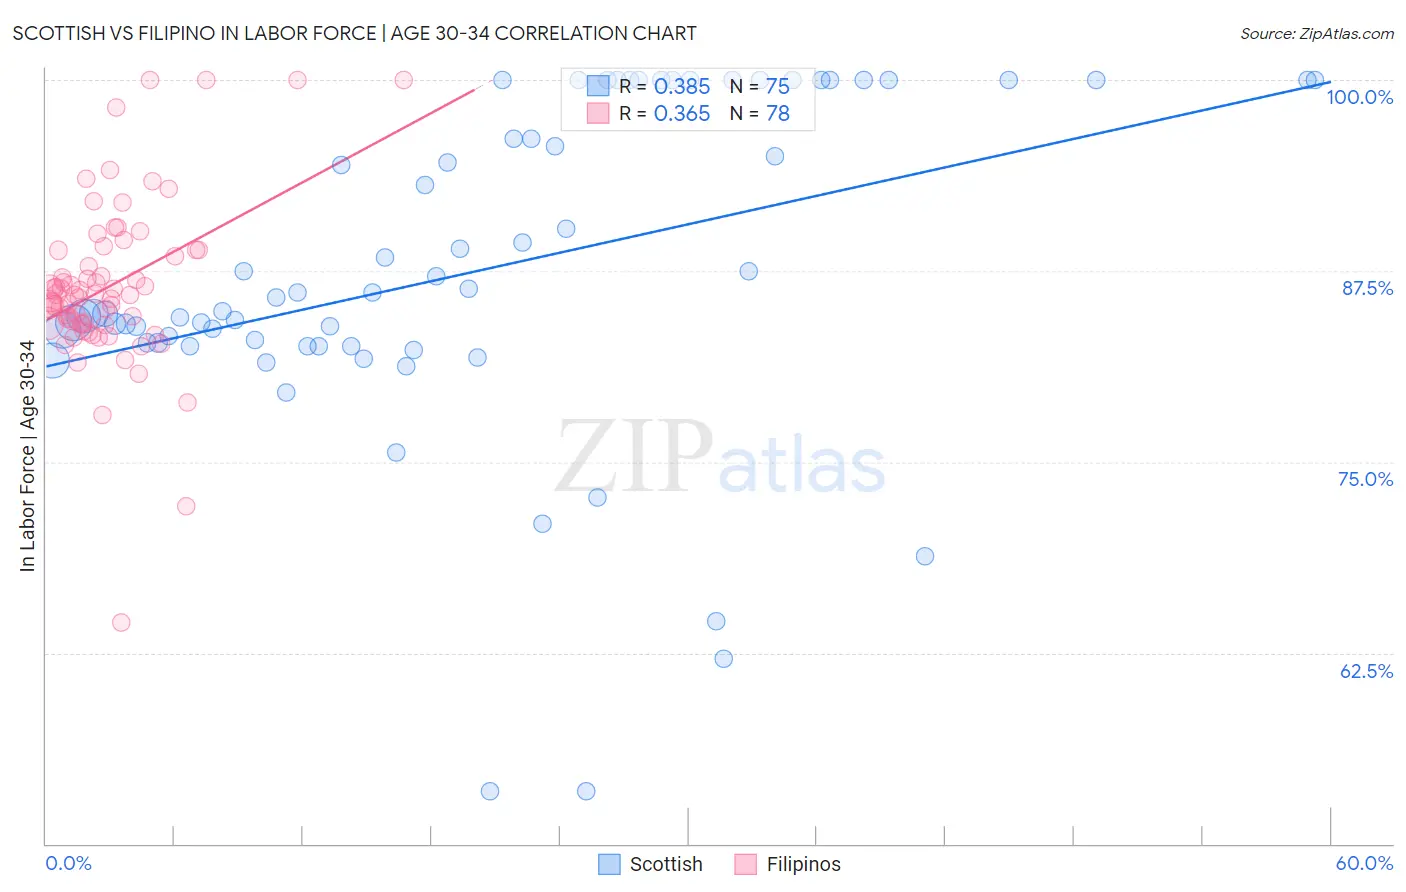
Scottish vs Filipino In Labor Force | Age 30-34 Correlation Chart
The statistical analysis conducted on geographies consisting of 565,856,889 people shows a mild positive correlation between the proportion of Scottish and labor force participation rate among population between the ages 30 and 34 in the United States with a correlation coefficient (R) of 0.385 and weighted average of 84.2%. Similarly, the statistical analysis conducted on geographies consisting of 254,232,337 people shows a mild positive correlation between the proportion of Filipinos and labor force participation rate among population between the ages 30 and 34 in the United States with a correlation coefficient (R) of 0.365 and weighted average of 85.5%, a difference of 1.6%.
In Labor Force | Age 30-34 Correlation Summary
| Measurement | Scottish | Filipino |
| Minimum | 53.4% | 64.5% |
| Maximum | 100.0% | 100.0% |
| Range | 46.6% | 35.5% |
| Mean | 87.5% | 86.5% |
| Median | 85.8% | 85.9% |
| Interquartile 25% (IQ1) | 82.6% | 84.1% |
| Interquartile 75% (IQ3) | 100.0% | 88.9% |
| Interquartile Range (IQR) | 17.4% | 4.8% |
| Standard Deviation (Sample) | 10.8% | 5.5% |
| Standard Deviation (Population) | 10.7% | 5.4% |
Similar Demographics by In Labor Force | Age 30-34
Demographics Similar to Scottish by In Labor Force | Age 30-34
In terms of in labor force | age 30-34, the demographic groups most similar to Scottish are Immigrants from El Salvador (84.2%, a difference of 0.0%), Immigrants from Cuba (84.2%, a difference of 0.010%), Immigrants from Haiti (84.2%, a difference of 0.010%), Cuban (84.2%, a difference of 0.020%), and Welsh (84.2%, a difference of 0.020%).
| Demographics | Rating | Rank | In Labor Force | Age 30-34 |
| Immigrants | Panama | 6.3 /100 | #218 | Tragic 84.3% |
| Swiss | 5.8 /100 | #219 | Tragic 84.3% |
| Danes | 5.3 /100 | #220 | Tragic 84.3% |
| Salvadorans | 3.8 /100 | #221 | Tragic 84.2% |
| Panamanians | 3.8 /100 | #222 | Tragic 84.2% |
| Immigrants | Laos | 3.6 /100 | #223 | Tragic 84.2% |
| Cubans | 3.4 /100 | #224 | Tragic 84.2% |
| Scottish | 3.1 /100 | #225 | Tragic 84.2% |
| Immigrants | El Salvador | 3.0 /100 | #226 | Tragic 84.2% |
| Immigrants | Cuba | 3.0 /100 | #227 | Tragic 84.2% |
| Immigrants | Haiti | 2.8 /100 | #228 | Tragic 84.2% |
| Welsh | 2.7 /100 | #229 | Tragic 84.2% |
| Immigrants | Bahamas | 2.6 /100 | #230 | Tragic 84.1% |
| Malaysians | 2.2 /100 | #231 | Tragic 84.1% |
| Immigrants | Immigrants | 2.0 /100 | #232 | Tragic 84.1% |
Demographics Similar to Filipinos by In Labor Force | Age 30-34
In terms of in labor force | age 30-34, the demographic groups most similar to Filipinos are Immigrants from Kenya (85.5%, a difference of 0.010%), Immigrants from Turkey (85.5%, a difference of 0.020%), Czech (85.5%, a difference of 0.020%), Russian (85.5%, a difference of 0.030%), and Polish (85.5%, a difference of 0.030%).
| Demographics | Rating | Rank | In Labor Force | Age 30-34 |
| Immigrants | Morocco | 99.8 /100 | #46 | Exceptional 85.6% |
| Croatians | 99.8 /100 | #47 | Exceptional 85.6% |
| Immigrants | Sweden | 99.8 /100 | #48 | Exceptional 85.6% |
| Lithuanians | 99.8 /100 | #49 | Exceptional 85.6% |
| Immigrants | Australia | 99.8 /100 | #50 | Exceptional 85.6% |
| Cape Verdeans | 99.7 /100 | #51 | Exceptional 85.6% |
| Slovenes | 99.7 /100 | #52 | Exceptional 85.6% |
| Filipinos | 99.6 /100 | #53 | Exceptional 85.5% |
| Immigrants | Kenya | 99.6 /100 | #54 | Exceptional 85.5% |
| Immigrants | Turkey | 99.6 /100 | #55 | Exceptional 85.5% |
| Czechs | 99.6 /100 | #56 | Exceptional 85.5% |
| Russians | 99.6 /100 | #57 | Exceptional 85.5% |
| Poles | 99.6 /100 | #58 | Exceptional 85.5% |
| Immigrants | Poland | 99.5 /100 | #59 | Exceptional 85.5% |
| Immigrants | France | 99.5 /100 | #60 | Exceptional 85.5% |