Scandinavian vs Italian In Labor Force | Age 30-34
COMPARE
Scandinavian
Italian
In Labor Force | Age 30-34
In Labor Force | Age 30-34 Comparison
Scandinavians
Italians
84.5%
IN LABOR FORCE | AGE 30-34
24.7/ 100
METRIC RATING
192nd/ 347
METRIC RANK
85.4%
IN LABOR FORCE | AGE 30-34
99.4/ 100
METRIC RATING
64th/ 347
METRIC RANK
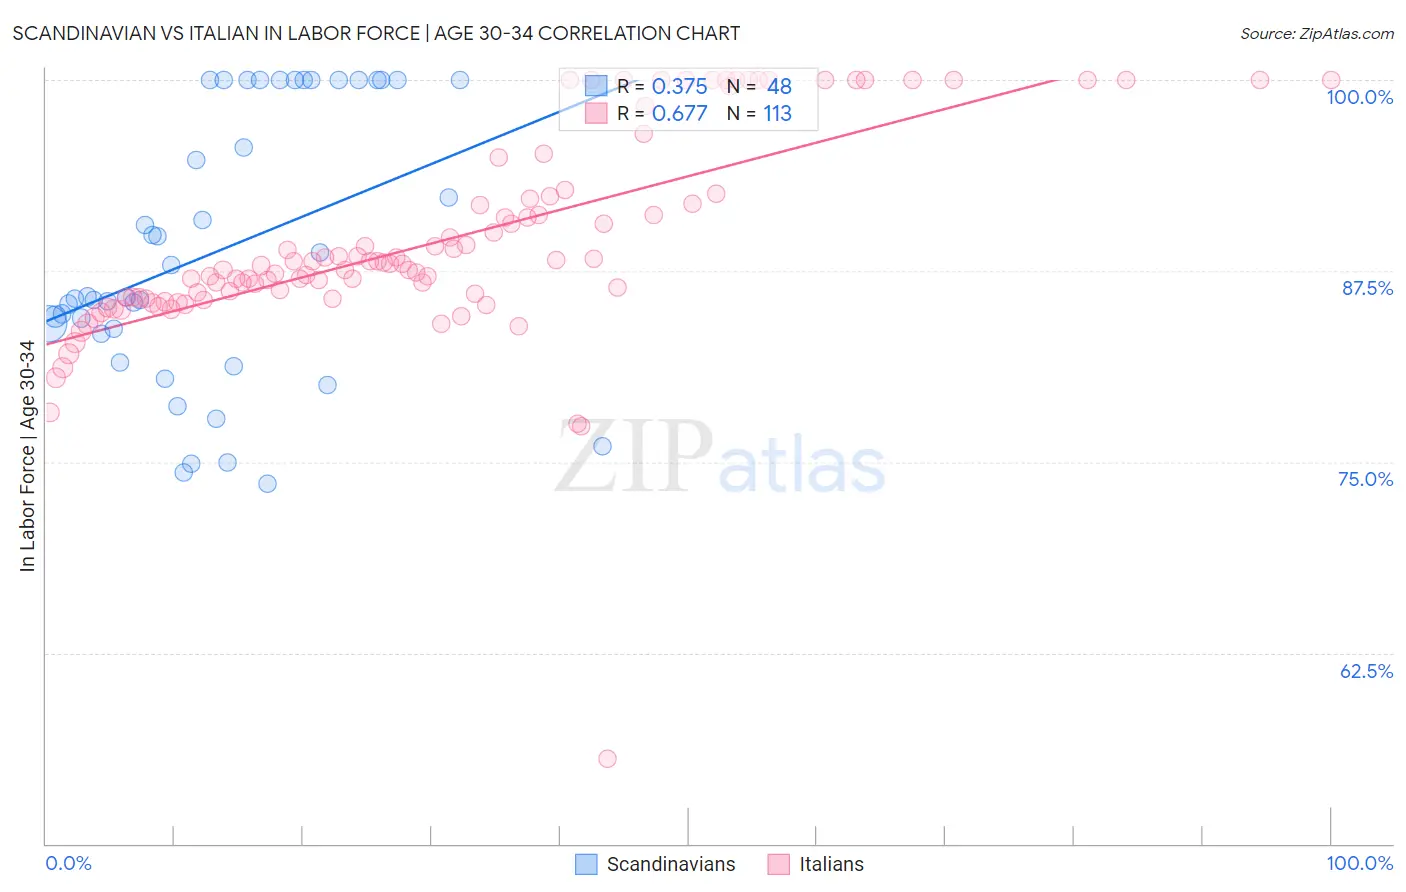
Scandinavian vs Italian In Labor Force | Age 30-34 Correlation Chart
The statistical analysis conducted on geographies consisting of 472,088,741 people shows a mild positive correlation between the proportion of Scandinavians and labor force participation rate among population between the ages 30 and 34 in the United States with a correlation coefficient (R) of 0.375 and weighted average of 84.5%. Similarly, the statistical analysis conducted on geographies consisting of 573,629,236 people shows a significant positive correlation between the proportion of Italians and labor force participation rate among population between the ages 30 and 34 in the United States with a correlation coefficient (R) of 0.677 and weighted average of 85.4%, a difference of 1.1%.
In Labor Force | Age 30-34 Correlation Summary
| Measurement | Scandinavian | Italian |
| Minimum | 73.6% | 55.6% |
| Maximum | 100.0% | 100.0% |
| Range | 26.4% | 44.4% |
| Mean | 88.8% | 89.4% |
| Median | 85.8% | 87.9% |
| Interquartile 25% (IQ1) | 83.5% | 85.7% |
| Interquartile 75% (IQ3) | 100.0% | 92.3% |
| Interquartile Range (IQR) | 16.5% | 6.6% |
| Standard Deviation (Sample) | 8.7% | 6.7% |
| Standard Deviation (Population) | 8.6% | 6.7% |
Similar Demographics by In Labor Force | Age 30-34
Demographics Similar to Scandinavians by In Labor Force | Age 30-34
In terms of in labor force | age 30-34, the demographic groups most similar to Scandinavians are Hungarian (84.5%, a difference of 0.0%), Immigrants from Zaire (84.5%, a difference of 0.010%), Immigrants from Costa Rica (84.5%, a difference of 0.010%), Immigrants from Afghanistan (84.5%, a difference of 0.010%), and Korean (84.5%, a difference of 0.010%).
| Demographics | Rating | Rank | In Labor Force | Age 30-34 |
| Immigrants | Philippines | 31.5 /100 | #185 | Fair 84.6% |
| Immigrants | Congo | 29.7 /100 | #186 | Fair 84.6% |
| Costa Ricans | 29.6 /100 | #187 | Fair 84.6% |
| Taiwanese | 29.4 /100 | #188 | Fair 84.6% |
| Nigerians | 28.9 /100 | #189 | Fair 84.5% |
| Immigrants | Zaire | 25.8 /100 | #190 | Fair 84.5% |
| Hungarians | 24.8 /100 | #191 | Fair 84.5% |
| Scandinavians | 24.7 /100 | #192 | Fair 84.5% |
| Immigrants | Costa Rica | 23.9 /100 | #193 | Fair 84.5% |
| Immigrants | Afghanistan | 23.5 /100 | #194 | Fair 84.5% |
| Koreans | 23.2 /100 | #195 | Fair 84.5% |
| British | 22.9 /100 | #196 | Fair 84.5% |
| Immigrants | Syria | 21.9 /100 | #197 | Fair 84.5% |
| Dutch | 20.2 /100 | #198 | Fair 84.5% |
| Immigrants | Thailand | 19.1 /100 | #199 | Poor 84.5% |
Demographics Similar to Italians by In Labor Force | Age 30-34
In terms of in labor force | age 30-34, the demographic groups most similar to Italians are Senegalese (85.4%, a difference of 0.0%), Soviet Union (85.5%, a difference of 0.010%), Macedonian (85.5%, a difference of 0.010%), Ghanaian (85.4%, a difference of 0.010%), and Immigrants from France (85.5%, a difference of 0.020%).
| Demographics | Rating | Rank | In Labor Force | Age 30-34 |
| Russians | 99.6 /100 | #57 | Exceptional 85.5% |
| Poles | 99.6 /100 | #58 | Exceptional 85.5% |
| Immigrants | Poland | 99.5 /100 | #59 | Exceptional 85.5% |
| Immigrants | France | 99.5 /100 | #60 | Exceptional 85.5% |
| Immigrants | Brazil | 99.5 /100 | #61 | Exceptional 85.5% |
| Soviet Union | 99.4 /100 | #62 | Exceptional 85.5% |
| Macedonians | 99.4 /100 | #63 | Exceptional 85.5% |
| Italians | 99.4 /100 | #64 | Exceptional 85.4% |
| Senegalese | 99.4 /100 | #65 | Exceptional 85.4% |
| Ghanaians | 99.4 /100 | #66 | Exceptional 85.4% |
| Kenyans | 99.3 /100 | #67 | Exceptional 85.4% |
| Immigrants | Eastern Europe | 99.3 /100 | #68 | Exceptional 85.4% |
| Immigrants | Iran | 99.2 /100 | #69 | Exceptional 85.4% |
| Brazilians | 99.1 /100 | #70 | Exceptional 85.4% |
| Immigrants | Japan | 99.1 /100 | #71 | Exceptional 85.4% |