Puerto Rican vs Osage In Labor Force | Age 25-29
COMPARE
Puerto Rican
Osage
In Labor Force | Age 25-29
In Labor Force | Age 25-29 Comparison
Puerto Ricans
Osage
80.4%
IN LABOR FORCE | AGE 25-29
0.0/ 100
METRIC RATING
330th/ 347
METRIC RANK
82.3%
IN LABOR FORCE | AGE 25-29
0.0/ 100
METRIC RATING
310th/ 347
METRIC RANK
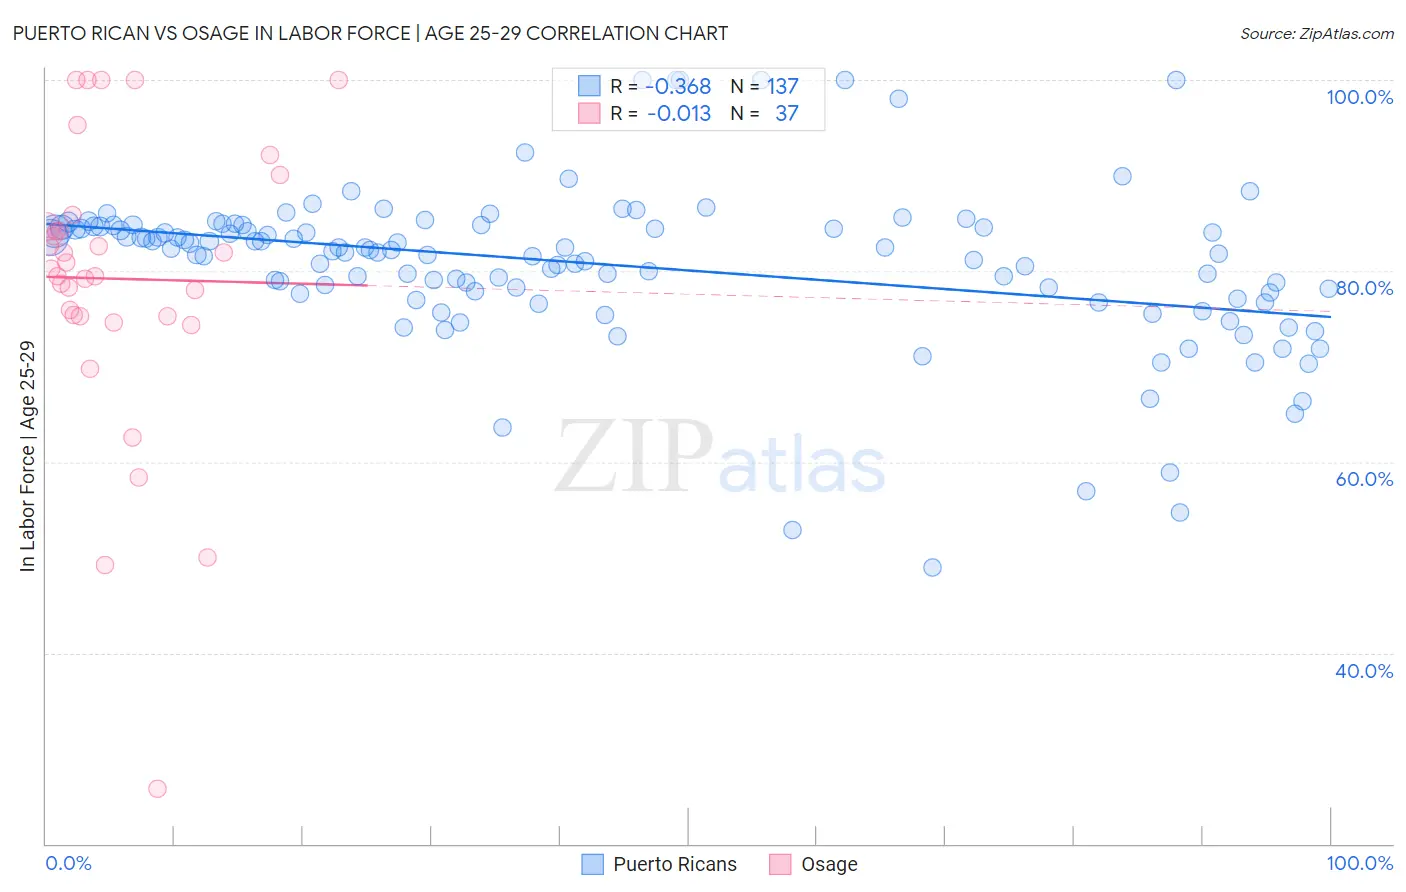
Puerto Rican vs Osage In Labor Force | Age 25-29 Correlation Chart
The statistical analysis conducted on geographies consisting of 527,795,348 people shows a mild negative correlation between the proportion of Puerto Ricans and labor force participation rate among population between the ages 25 and 29 in the United States with a correlation coefficient (R) of -0.368 and weighted average of 80.4%. Similarly, the statistical analysis conducted on geographies consisting of 91,794,280 people shows no correlation between the proportion of Osage and labor force participation rate among population between the ages 25 and 29 in the United States with a correlation coefficient (R) of -0.013 and weighted average of 82.3%, a difference of 2.3%.
In Labor Force | Age 25-29 Correlation Summary
| Measurement | Puerto Rican | Osage |
| Minimum | 48.9% | 25.7% |
| Maximum | 100.0% | 100.0% |
| Range | 51.1% | 74.3% |
| Mean | 80.7% | 79.2% |
| Median | 82.2% | 80.2% |
| Interquartile 25% (IQ1) | 77.7% | 75.3% |
| Interquartile 75% (IQ3) | 84.6% | 85.2% |
| Interquartile Range (IQR) | 6.9% | 9.9% |
| Standard Deviation (Sample) | 8.4% | 15.3% |
| Standard Deviation (Population) | 8.3% | 15.1% |
Demographics Similar to Puerto Ricans and Osage by In Labor Force | Age 25-29
In terms of in labor force | age 25-29, the demographic groups most similar to Puerto Ricans are Yakama (80.6%, a difference of 0.23%), Creek (80.7%, a difference of 0.34%), Ute (80.8%, a difference of 0.48%), Choctaw (81.0%, a difference of 0.69%), and Dutch West Indian (81.1%, a difference of 0.89%). Similarly, the demographic groups most similar to Osage are Alaskan Athabascan (82.3%, a difference of 0.010%), Hispanic or Latino (82.2%, a difference of 0.080%), Yaqui (82.2%, a difference of 0.17%), Cherokee (82.1%, a difference of 0.22%), and Immigrants from Mexico (82.0%, a difference of 0.35%).
| Demographics | Rating | Rank | In Labor Force | Age 25-29 |
| Osage | 0.0 /100 | #310 | Tragic 82.3% |
| Alaskan Athabascans | 0.0 /100 | #311 | Tragic 82.3% |
| Hispanics or Latinos | 0.0 /100 | #312 | Tragic 82.2% |
| Yaqui | 0.0 /100 | #313 | Tragic 82.2% |
| Cherokee | 0.0 /100 | #314 | Tragic 82.1% |
| Immigrants | Mexico | 0.0 /100 | #315 | Tragic 82.0% |
| Mexicans | 0.0 /100 | #316 | Tragic 81.9% |
| Chickasaw | 0.0 /100 | #317 | Tragic 81.9% |
| Comanche | 0.0 /100 | #318 | Tragic 81.9% |
| Seminole | 0.0 /100 | #319 | Tragic 81.7% |
| Colville | 0.0 /100 | #320 | Tragic 81.6% |
| Shoshone | 0.0 /100 | #321 | Tragic 81.6% |
| Kiowa | 0.0 /100 | #322 | Tragic 81.6% |
| Alaska Natives | 0.0 /100 | #323 | Tragic 81.6% |
| Houma | 0.0 /100 | #324 | Tragic 81.2% |
| Dutch West Indians | 0.0 /100 | #325 | Tragic 81.1% |
| Choctaw | 0.0 /100 | #326 | Tragic 81.0% |
| Ute | 0.0 /100 | #327 | Tragic 80.8% |
| Creek | 0.0 /100 | #328 | Tragic 80.7% |
| Yakama | 0.0 /100 | #329 | Tragic 80.6% |
| Puerto Ricans | 0.0 /100 | #330 | Tragic 80.4% |