Pueblo vs Chilean In Labor Force | Age 25-29
COMPARE
Pueblo
Chilean
In Labor Force | Age 25-29
In Labor Force | Age 25-29 Comparison
Pueblo
Chileans
77.5%
IN LABOR FORCE | AGE 25-29
0.0/ 100
METRIC RATING
342nd/ 347
METRIC RANK
85.0%
IN LABOR FORCE | AGE 25-29
88.8/ 100
METRIC RATING
116th/ 347
METRIC RANK
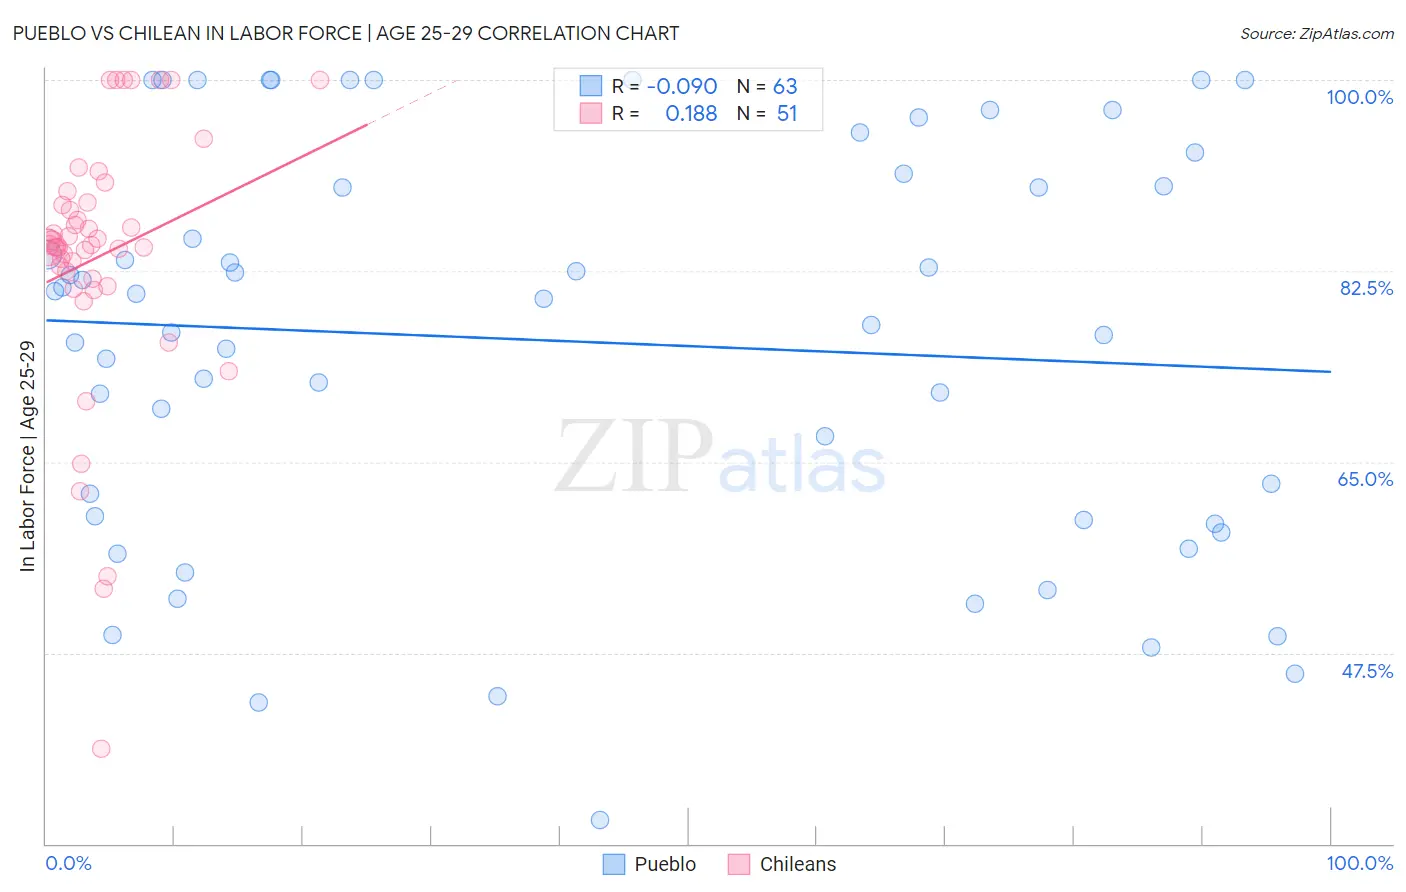
Pueblo vs Chilean In Labor Force | Age 25-29 Correlation Chart
The statistical analysis conducted on geographies consisting of 120,058,424 people shows a slight negative correlation between the proportion of Pueblo and labor force participation rate among population between the ages 25 and 29 in the United States with a correlation coefficient (R) of -0.090 and weighted average of 77.5%. Similarly, the statistical analysis conducted on geographies consisting of 256,647,437 people shows a poor positive correlation between the proportion of Chileans and labor force participation rate among population between the ages 25 and 29 in the United States with a correlation coefficient (R) of 0.188 and weighted average of 85.0%, a difference of 9.7%.
In Labor Force | Age 25-29 Correlation Summary
| Measurement | Pueblo | Chilean |
| Minimum | 32.2% | 38.7% |
| Maximum | 100.0% | 100.0% |
| Range | 67.8% | 61.3% |
| Mean | 76.1% | 83.8% |
| Median | 80.0% | 84.8% |
| Interquartile 25% (IQ1) | 59.7% | 81.8% |
| Interquartile 75% (IQ3) | 91.4% | 88.8% |
| Interquartile Range (IQR) | 31.7% | 7.0% |
| Standard Deviation (Sample) | 18.3% | 12.1% |
| Standard Deviation (Population) | 18.2% | 12.0% |
Similar Demographics by In Labor Force | Age 25-29
Demographics Similar to Pueblo by In Labor Force | Age 25-29
In terms of in labor force | age 25-29, the demographic groups most similar to Pueblo are Tohono O'odham (77.5%, a difference of 0.010%), Paiute (78.1%, a difference of 0.80%), Immigrants from Yemen (78.2%, a difference of 0.96%), Lumbee (78.3%, a difference of 1.1%), and Arapaho (76.6%, a difference of 1.2%).
| Demographics | Rating | Rank | In Labor Force | Age 25-29 |
| Sioux | 0.0 /100 | #333 | Tragic 79.7% |
| Yuman | 0.0 /100 | #334 | Tragic 79.3% |
| Natives/Alaskans | 0.0 /100 | #335 | Tragic 79.3% |
| Apache | 0.0 /100 | #336 | Tragic 79.2% |
| Crow | 0.0 /100 | #337 | Tragic 78.6% |
| Lumbee | 0.0 /100 | #338 | Tragic 78.3% |
| Immigrants | Yemen | 0.0 /100 | #339 | Tragic 78.2% |
| Paiute | 0.0 /100 | #340 | Tragic 78.1% |
| Tohono O'odham | 0.0 /100 | #341 | Tragic 77.5% |
| Pueblo | 0.0 /100 | #342 | Tragic 77.5% |
| Arapaho | 0.0 /100 | #343 | Tragic 76.6% |
| Hopi | 0.0 /100 | #344 | Tragic 76.5% |
| Navajo | 0.0 /100 | #345 | Tragic 74.6% |
| Pima | 0.0 /100 | #346 | Tragic 74.3% |
| Yup'ik | 0.0 /100 | #347 | Tragic 73.1% |
Demographics Similar to Chileans by In Labor Force | Age 25-29
In terms of in labor force | age 25-29, the demographic groups most similar to Chileans are South African (85.0%, a difference of 0.0%), Immigrants from Belarus (85.0%, a difference of 0.020%), Finnish (85.0%, a difference of 0.020%), Immigrants from Malaysia (85.0%, a difference of 0.030%), and Filipino (84.9%, a difference of 0.030%).
| Demographics | Rating | Rank | In Labor Force | Age 25-29 |
| Costa Ricans | 91.9 /100 | #109 | Exceptional 85.0% |
| New Zealanders | 91.5 /100 | #110 | Exceptional 85.0% |
| Immigrants | Middle Africa | 91.4 /100 | #111 | Exceptional 85.0% |
| Senegalese | 90.9 /100 | #112 | Exceptional 85.0% |
| Irish | 90.6 /100 | #113 | Exceptional 85.0% |
| Immigrants | Malaysia | 90.4 /100 | #114 | Exceptional 85.0% |
| South Africans | 88.9 /100 | #115 | Excellent 85.0% |
| Chileans | 88.8 /100 | #116 | Excellent 85.0% |
| Immigrants | Belarus | 88.0 /100 | #117 | Excellent 85.0% |
| Finns | 87.8 /100 | #118 | Excellent 85.0% |
| Filipinos | 87.1 /100 | #119 | Excellent 84.9% |
| Immigrants | South Africa | 86.1 /100 | #120 | Excellent 84.9% |
| Immigrants | Chile | 85.6 /100 | #121 | Excellent 84.9% |
| Scandinavians | 85.1 /100 | #122 | Excellent 84.9% |
| Dutch | 84.9 /100 | #123 | Excellent 84.9% |