Macedonian vs Dutch West Indian In Labor Force | Age 20-64
COMPARE
Macedonian
Dutch West Indian
In Labor Force | Age 20-64
In Labor Force | Age 20-64 Comparison
Macedonians
Dutch West Indians
80.2%
IN LABOR FORCE | AGE 20-64
98.7/ 100
METRIC RATING
66th/ 347
METRIC RANK
75.5%
IN LABOR FORCE | AGE 20-64
0.0/ 100
METRIC RATING
322nd/ 347
METRIC RANK
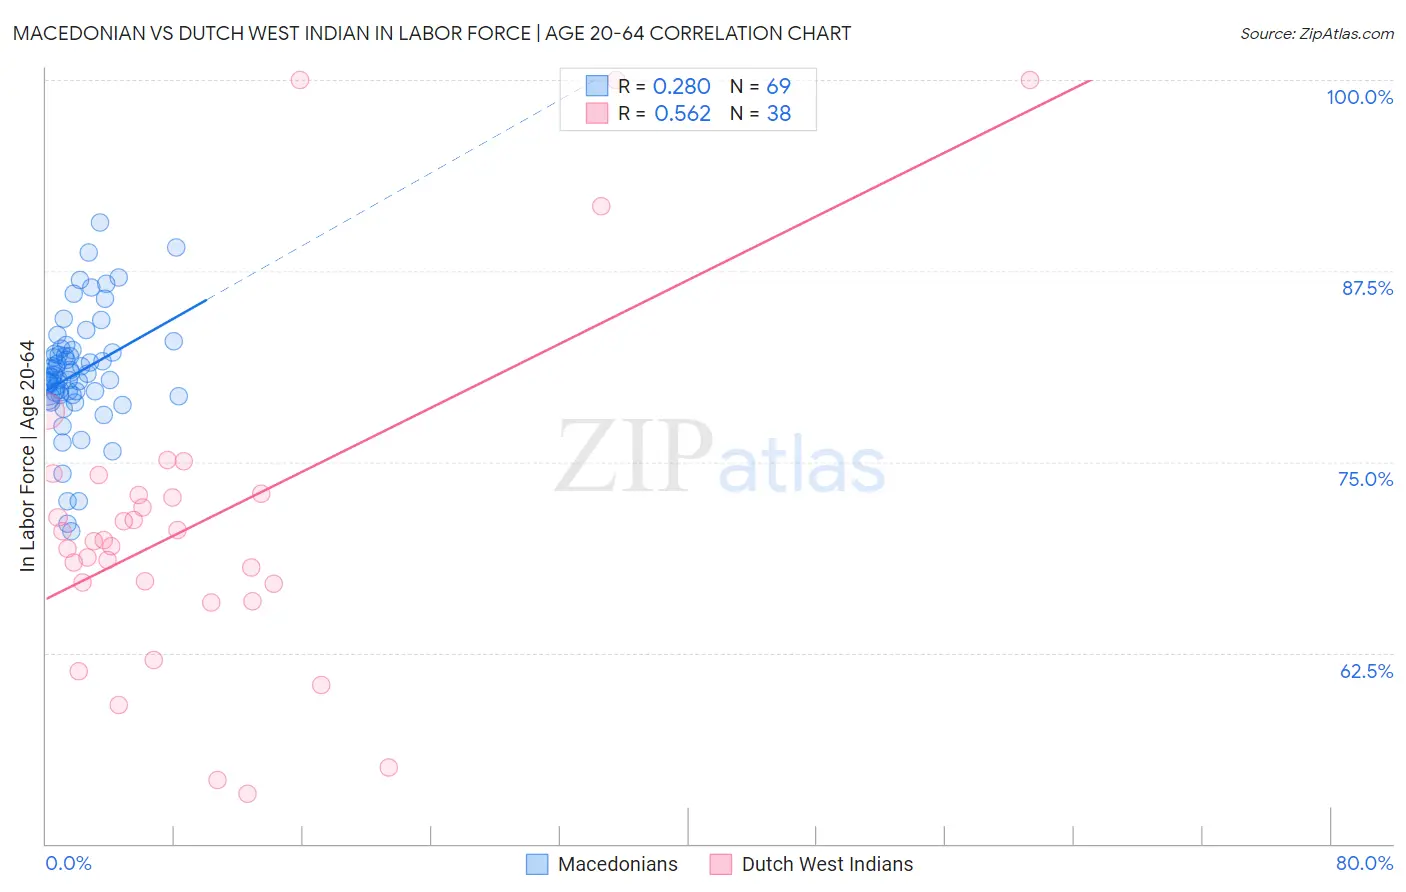
Macedonian vs Dutch West Indian In Labor Force | Age 20-64 Correlation Chart
The statistical analysis conducted on geographies consisting of 132,660,351 people shows a weak positive correlation between the proportion of Macedonians and labor force participation rate among population between the ages 20 and 64 in the United States with a correlation coefficient (R) of 0.280 and weighted average of 80.2%. Similarly, the statistical analysis conducted on geographies consisting of 85,770,451 people shows a substantial positive correlation between the proportion of Dutch West Indians and labor force participation rate among population between the ages 20 and 64 in the United States with a correlation coefficient (R) of 0.562 and weighted average of 75.5%, a difference of 6.3%.
In Labor Force | Age 20-64 Correlation Summary
| Measurement | Macedonian | Dutch West Indian |
| Minimum | 70.5% | 53.3% |
| Maximum | 90.7% | 100.0% |
| Range | 20.2% | 46.7% |
| Mean | 80.8% | 71.2% |
| Median | 80.7% | 69.9% |
| Interquartile 25% (IQ1) | 79.4% | 67.0% |
| Interquartile 75% (IQ3) | 82.3% | 72.9% |
| Interquartile Range (IQR) | 2.9% | 5.9% |
| Standard Deviation (Sample) | 3.8% | 11.0% |
| Standard Deviation (Population) | 3.8% | 10.9% |
Similar Demographics by In Labor Force | Age 20-64
Demographics Similar to Macedonians by In Labor Force | Age 20-64
In terms of in labor force | age 20-64, the demographic groups most similar to Macedonians are Lithuanian (80.2%, a difference of 0.0%), Taiwanese (80.2%, a difference of 0.0%), Immigrants from Albania (80.3%, a difference of 0.010%), Bhutanese (80.2%, a difference of 0.010%), and Albanian (80.2%, a difference of 0.010%).
| Demographics | Rating | Rank | In Labor Force | Age 20-64 |
| Swedes | 98.9 /100 | #59 | Exceptional 80.3% |
| Tongans | 98.8 /100 | #60 | Exceptional 80.3% |
| Burmese | 98.8 /100 | #61 | Exceptional 80.3% |
| Carpatho Rusyns | 98.8 /100 | #62 | Exceptional 80.3% |
| Immigrants | Korea | 98.8 /100 | #63 | Exceptional 80.3% |
| Immigrants | Albania | 98.7 /100 | #64 | Exceptional 80.3% |
| Lithuanians | 98.7 /100 | #65 | Exceptional 80.2% |
| Macedonians | 98.7 /100 | #66 | Exceptional 80.2% |
| Taiwanese | 98.6 /100 | #67 | Exceptional 80.2% |
| Bhutanese | 98.6 /100 | #68 | Exceptional 80.2% |
| Albanians | 98.6 /100 | #69 | Exceptional 80.2% |
| Immigrants | Turkey | 98.5 /100 | #70 | Exceptional 80.2% |
| Soviet Union | 98.5 /100 | #71 | Exceptional 80.2% |
| Eastern Europeans | 98.4 /100 | #72 | Exceptional 80.2% |
| Cypriots | 98.2 /100 | #73 | Exceptional 80.2% |
Demographics Similar to Dutch West Indians by In Labor Force | Age 20-64
In terms of in labor force | age 20-64, the demographic groups most similar to Dutch West Indians are Cajun (75.5%, a difference of 0.040%), Seminole (75.5%, a difference of 0.050%), Choctaw (75.4%, a difference of 0.10%), Menominee (75.3%, a difference of 0.23%), and Yakama (75.8%, a difference of 0.40%).
| Demographics | Rating | Rank | In Labor Force | Age 20-64 |
| Ottawa | 0.0 /100 | #315 | Tragic 76.7% |
| Yaqui | 0.0 /100 | #316 | Tragic 76.5% |
| Cherokee | 0.0 /100 | #317 | Tragic 76.2% |
| Chickasaw | 0.0 /100 | #318 | Tragic 76.2% |
| Inupiat | 0.0 /100 | #319 | Tragic 76.1% |
| Yakama | 0.0 /100 | #320 | Tragic 75.8% |
| Seminole | 0.0 /100 | #321 | Tragic 75.5% |
| Dutch West Indians | 0.0 /100 | #322 | Tragic 75.5% |
| Cajuns | 0.0 /100 | #323 | Tragic 75.5% |
| Choctaw | 0.0 /100 | #324 | Tragic 75.4% |
| Menominee | 0.0 /100 | #325 | Tragic 75.3% |
| Creek | 0.0 /100 | #326 | Tragic 75.1% |
| Sioux | 0.0 /100 | #327 | Tragic 75.0% |
| Kiowa | 0.0 /100 | #328 | Tragic 75.0% |
| Cheyenne | 0.0 /100 | #329 | Tragic 74.8% |