Lithuanian vs Immigrants from Russia In Labor Force | Age 30-34
COMPARE
Lithuanian
Immigrants from Russia
In Labor Force | Age 30-34
In Labor Force | Age 30-34 Comparison
Lithuanians
Immigrants from Russia
85.6%
IN LABOR FORCE | AGE 30-34
99.8/ 100
METRIC RATING
49th/ 347
METRIC RANK
85.3%
IN LABOR FORCE | AGE 30-34
98.7/ 100
METRIC RATING
80th/ 347
METRIC RANK
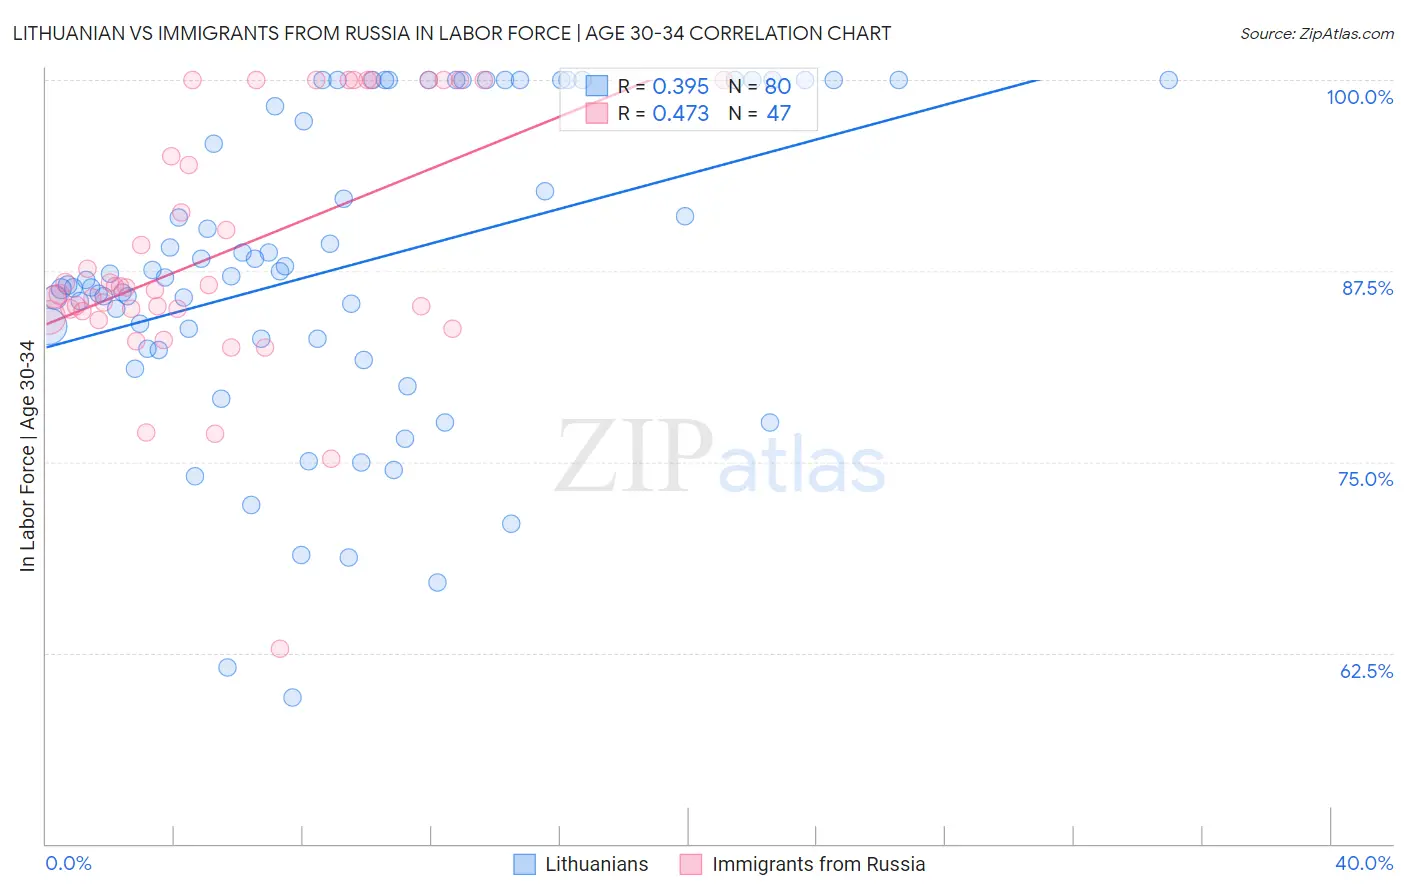
Lithuanian vs Immigrants from Russia In Labor Force | Age 30-34 Correlation Chart
The statistical analysis conducted on geographies consisting of 421,576,687 people shows a mild positive correlation between the proportion of Lithuanians and labor force participation rate among population between the ages 30 and 34 in the United States with a correlation coefficient (R) of 0.395 and weighted average of 85.6%. Similarly, the statistical analysis conducted on geographies consisting of 347,731,999 people shows a moderate positive correlation between the proportion of Immigrants from Russia and labor force participation rate among population between the ages 30 and 34 in the United States with a correlation coefficient (R) of 0.473 and weighted average of 85.3%, a difference of 0.30%.
In Labor Force | Age 30-34 Correlation Summary
| Measurement | Lithuanian | Immigrants from Russia |
| Minimum | 59.6% | 62.8% |
| Maximum | 100.0% | 100.0% |
| Range | 40.4% | 37.2% |
| Mean | 87.7% | 88.7% |
| Median | 87.1% | 86.4% |
| Interquartile 25% (IQ1) | 82.7% | 84.9% |
| Interquartile 75% (IQ3) | 100.0% | 100.0% |
| Interquartile Range (IQR) | 17.3% | 15.1% |
| Standard Deviation (Sample) | 10.1% | 8.2% |
| Standard Deviation (Population) | 10.0% | 8.1% |
Similar Demographics by In Labor Force | Age 30-34
Demographics Similar to Lithuanians by In Labor Force | Age 30-34
In terms of in labor force | age 30-34, the demographic groups most similar to Lithuanians are Immigrants from Sweden (85.6%, a difference of 0.010%), Immigrants from Australia (85.6%, a difference of 0.010%), Immigrants from Morocco (85.6%, a difference of 0.020%), Croatian (85.6%, a difference of 0.020%), and Immigrants from Nepal (85.6%, a difference of 0.030%).
| Demographics | Rating | Rank | In Labor Force | Age 30-34 |
| Zimbabweans | 99.8 /100 | #42 | Exceptional 85.6% |
| Immigrants | Lithuania | 99.8 /100 | #43 | Exceptional 85.6% |
| Immigrants | Sri Lanka | 99.8 /100 | #44 | Exceptional 85.6% |
| Immigrants | Nepal | 99.8 /100 | #45 | Exceptional 85.6% |
| Immigrants | Morocco | 99.8 /100 | #46 | Exceptional 85.6% |
| Croatians | 99.8 /100 | #47 | Exceptional 85.6% |
| Immigrants | Sweden | 99.8 /100 | #48 | Exceptional 85.6% |
| Lithuanians | 99.8 /100 | #49 | Exceptional 85.6% |
| Immigrants | Australia | 99.8 /100 | #50 | Exceptional 85.6% |
| Cape Verdeans | 99.7 /100 | #51 | Exceptional 85.6% |
| Slovenes | 99.7 /100 | #52 | Exceptional 85.6% |
| Filipinos | 99.6 /100 | #53 | Exceptional 85.5% |
| Immigrants | Kenya | 99.6 /100 | #54 | Exceptional 85.5% |
| Immigrants | Turkey | 99.6 /100 | #55 | Exceptional 85.5% |
| Czechs | 99.6 /100 | #56 | Exceptional 85.5% |
Demographics Similar to Immigrants from Russia by In Labor Force | Age 30-34
In terms of in labor force | age 30-34, the demographic groups most similar to Immigrants from Russia are Immigrants from Switzerland (85.3%, a difference of 0.0%), Immigrants from Singapore (85.3%, a difference of 0.010%), Slovak (85.3%, a difference of 0.010%), Immigrants from Africa (85.3%, a difference of 0.010%), and Immigrants from Europe (85.3%, a difference of 0.020%).
| Demographics | Rating | Rank | In Labor Force | Age 30-34 |
| Indians (Asian) | 99.0 /100 | #73 | Exceptional 85.4% |
| Maltese | 99.0 /100 | #74 | Exceptional 85.4% |
| Immigrants | Czechoslovakia | 99.0 /100 | #75 | Exceptional 85.4% |
| Iranians | 99.0 /100 | #76 | Exceptional 85.4% |
| Immigrants | Eastern Asia | 98.9 /100 | #77 | Exceptional 85.4% |
| Immigrants | Singapore | 98.8 /100 | #78 | Exceptional 85.3% |
| Immigrants | Switzerland | 98.7 /100 | #79 | Exceptional 85.3% |
| Immigrants | Russia | 98.7 /100 | #80 | Exceptional 85.3% |
| Slovaks | 98.7 /100 | #81 | Exceptional 85.3% |
| Immigrants | Africa | 98.6 /100 | #82 | Exceptional 85.3% |
| Immigrants | Europe | 98.6 /100 | #83 | Exceptional 85.3% |
| Greeks | 98.6 /100 | #84 | Exceptional 85.3% |
| Mongolians | 98.5 /100 | #85 | Exceptional 85.3% |
| Immigrants | Taiwan | 98.3 /100 | #86 | Exceptional 85.3% |
| Immigrants | Northern Europe | 98.2 /100 | #87 | Exceptional 85.3% |