Irish vs Immigrants from Kenya In Labor Force | Age 16-19
COMPARE
Irish
Immigrants from Kenya
In Labor Force | Age 16-19
In Labor Force | Age 16-19 Comparison
Irish
Immigrants from Kenya
42.0%
IN LABOR FORCE | AGE 16-19
100.0/ 100
METRIC RATING
31st/ 347
METRIC RANK
40.5%
IN LABOR FORCE | AGE 16-19
100.0/ 100
METRIC RATING
53rd/ 347
METRIC RANK
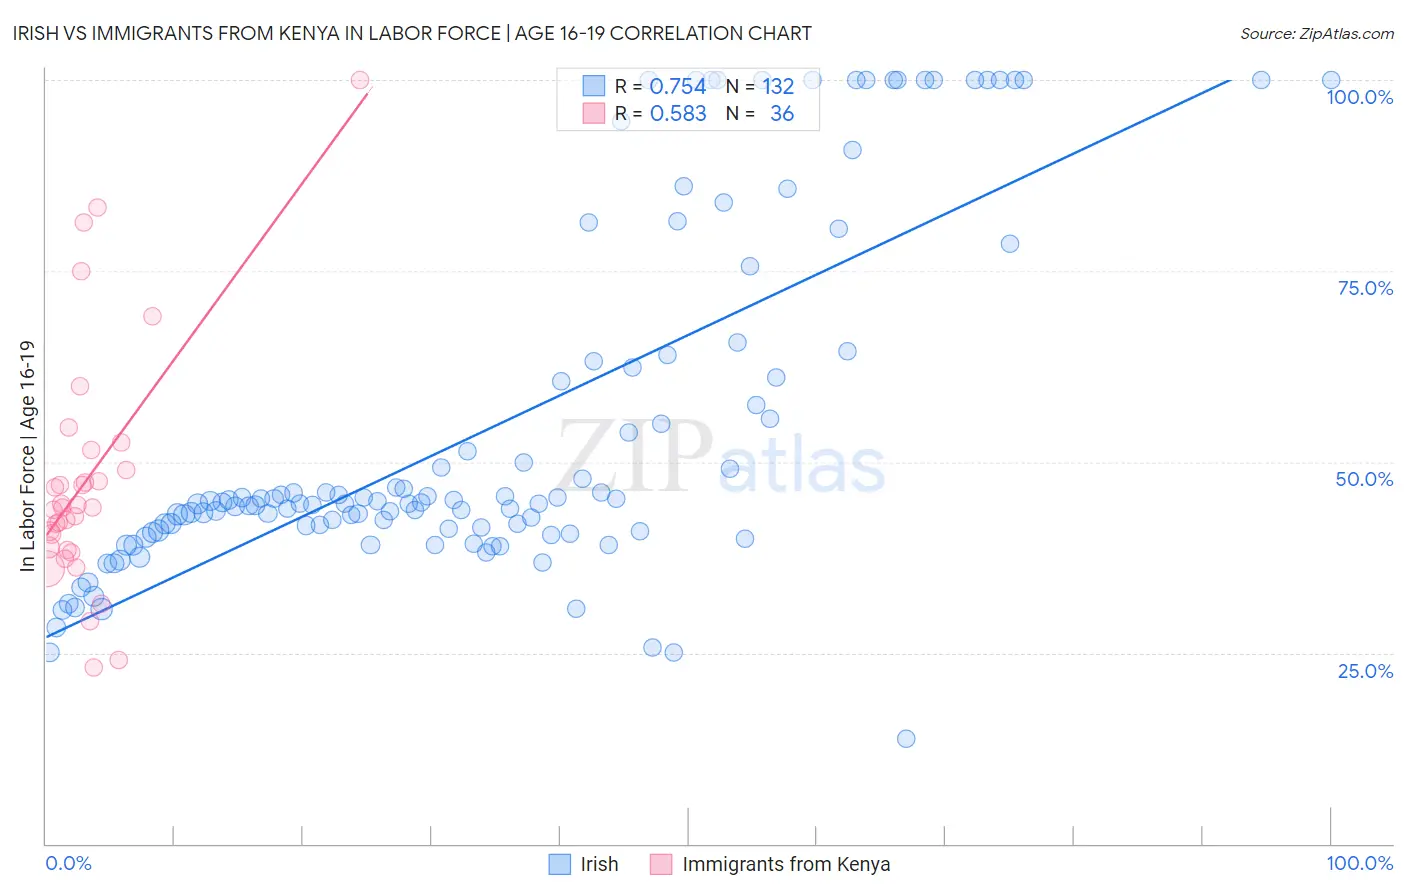
Irish vs Immigrants from Kenya In Labor Force | Age 16-19 Correlation Chart
The statistical analysis conducted on geographies consisting of 574,711,118 people shows a strong positive correlation between the proportion of Irish and labor force participation rate among population between the ages 16 and 19 in the United States with a correlation coefficient (R) of 0.754 and weighted average of 42.0%. Similarly, the statistical analysis conducted on geographies consisting of 218,036,354 people shows a substantial positive correlation between the proportion of Immigrants from Kenya and labor force participation rate among population between the ages 16 and 19 in the United States with a correlation coefficient (R) of 0.583 and weighted average of 40.5%, a difference of 3.6%.
In Labor Force | Age 16-19 Correlation Summary
| Measurement | Irish | Immigrants from Kenya |
| Minimum | 13.8% | 23.0% |
| Maximum | 100.0% | 100.0% |
| Range | 86.2% | 77.0% |
| Mean | 54.4% | 47.7% |
| Median | 44.6% | 44.0% |
| Interquartile 25% (IQ1) | 41.0% | 38.6% |
| Interquartile 75% (IQ3) | 62.8% | 50.3% |
| Interquartile Range (IQR) | 21.8% | 11.7% |
| Standard Deviation (Sample) | 22.9% | 16.3% |
| Standard Deviation (Population) | 22.8% | 16.0% |
Similar Demographics by In Labor Force | Age 16-19
Demographics Similar to Irish by In Labor Force | Age 16-19
In terms of in labor force | age 16-19, the demographic groups most similar to Irish are Scottish (42.0%, a difference of 0.070%), Czechoslovakian (41.9%, a difference of 0.20%), Liberian (41.8%, a difference of 0.34%), French (42.1%, a difference of 0.35%), and Polish (42.1%, a difference of 0.40%).
| Demographics | Rating | Rank | In Labor Force | Age 16-19 |
| Bangladeshis | 100.0 /100 | #24 | Exceptional 42.5% |
| German Russians | 100.0 /100 | #25 | Exceptional 42.4% |
| English | 100.0 /100 | #26 | Exceptional 42.4% |
| Welsh | 100.0 /100 | #27 | Exceptional 42.3% |
| Poles | 100.0 /100 | #28 | Exceptional 42.1% |
| French | 100.0 /100 | #29 | Exceptional 42.1% |
| Scottish | 100.0 /100 | #30 | Exceptional 42.0% |
| Irish | 100.0 /100 | #31 | Exceptional 42.0% |
| Czechoslovakians | 100.0 /100 | #32 | Exceptional 41.9% |
| Liberians | 100.0 /100 | #33 | Exceptional 41.8% |
| Immigrants | Bosnia and Herzegovina | 100.0 /100 | #34 | Exceptional 41.8% |
| Yugoslavians | 100.0 /100 | #35 | Exceptional 41.8% |
| Immigrants | Azores | 100.0 /100 | #36 | Exceptional 41.7% |
| Immigrants | Congo | 100.0 /100 | #37 | Exceptional 41.7% |
| Sioux | 100.0 /100 | #38 | Exceptional 41.5% |
Demographics Similar to Immigrants from Kenya by In Labor Force | Age 16-19
In terms of in labor force | age 16-19, the demographic groups most similar to Immigrants from Kenya are Tlingit-Haida (40.5%, a difference of 0.030%), British (40.5%, a difference of 0.060%), Fijian (40.4%, a difference of 0.15%), Lithuanian (40.4%, a difference of 0.17%), and Aleut (40.4%, a difference of 0.19%).
| Demographics | Rating | Rank | In Labor Force | Age 16-19 |
| Immigrants | Sudan | 100.0 /100 | #46 | Exceptional 41.0% |
| Carpatho Rusyns | 100.0 /100 | #47 | Exceptional 40.8% |
| Icelanders | 100.0 /100 | #48 | Exceptional 40.8% |
| Cree | 100.0 /100 | #49 | Exceptional 40.8% |
| Indonesians | 100.0 /100 | #50 | Exceptional 40.7% |
| Immigrants | Zaire | 100.0 /100 | #51 | Exceptional 40.7% |
| Immigrants | Laos | 100.0 /100 | #52 | Exceptional 40.6% |
| Immigrants | Kenya | 100.0 /100 | #53 | Exceptional 40.5% |
| Tlingit-Haida | 100.0 /100 | #54 | Exceptional 40.5% |
| British | 100.0 /100 | #55 | Exceptional 40.5% |
| Fijians | 100.0 /100 | #56 | Exceptional 40.4% |
| Lithuanians | 100.0 /100 | #57 | Exceptional 40.4% |
| Aleuts | 100.0 /100 | #58 | Exceptional 40.4% |
| Slavs | 100.0 /100 | #59 | Exceptional 40.4% |
| Immigrants | Eastern Africa | 100.0 /100 | #60 | Exceptional 40.4% |