Immigrants from Western Asia vs Ugandan In Labor Force | Age 35-44
COMPARE
Immigrants from Western Asia
Ugandan
In Labor Force | Age 35-44
In Labor Force | Age 35-44 Comparison
Immigrants from Western Asia
Ugandans
83.8%
IN LABOR FORCE | AGE 35-44
1.1/ 100
METRIC RATING
243rd/ 347
METRIC RANK
85.3%
IN LABOR FORCE | AGE 35-44
99.9/ 100
METRIC RATING
33rd/ 347
METRIC RANK
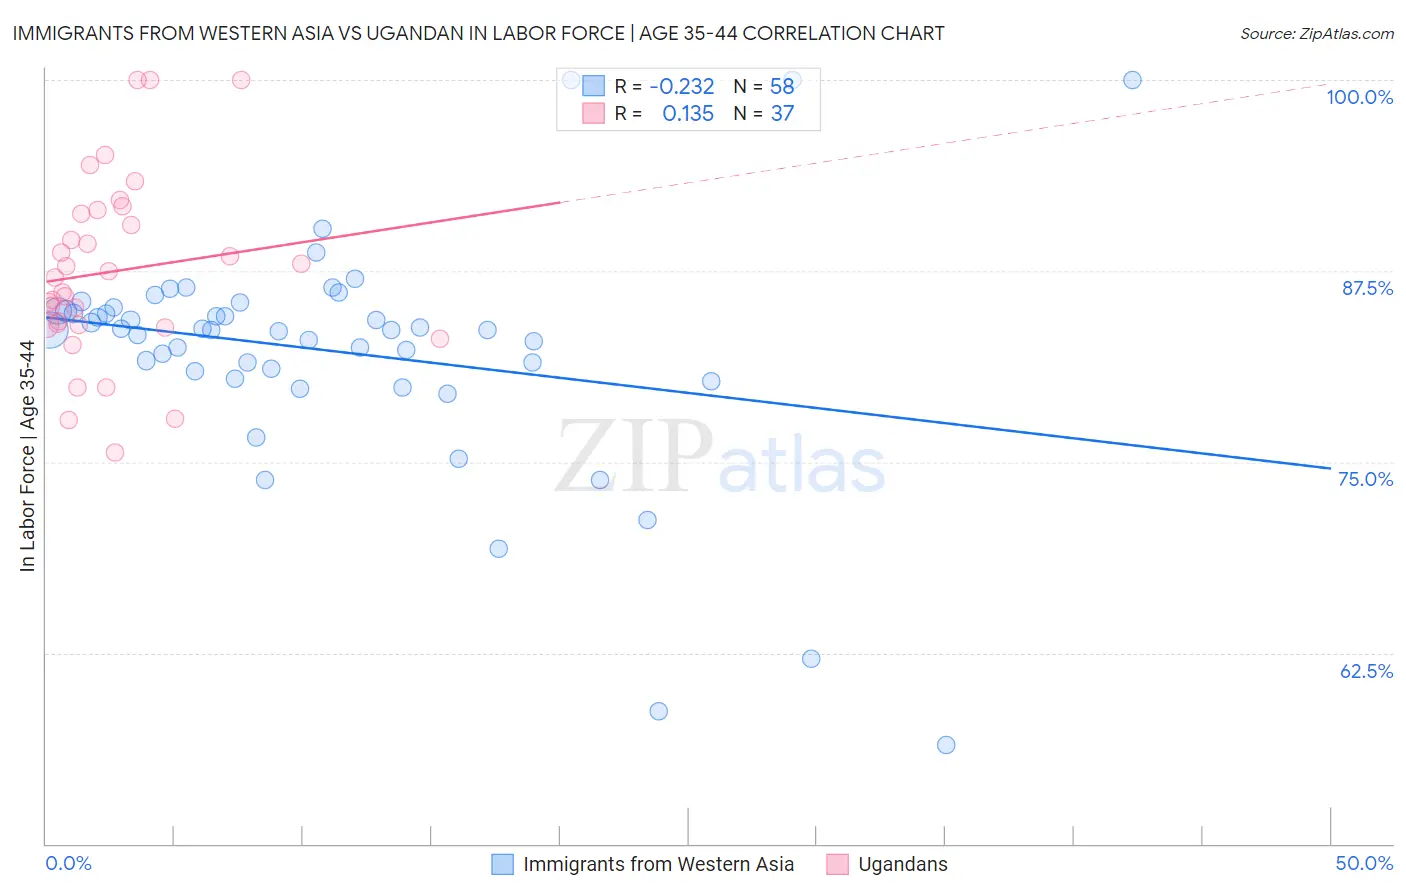
Immigrants from Western Asia vs Ugandan In Labor Force | Age 35-44 Correlation Chart
The statistical analysis conducted on geographies consisting of 404,178,045 people shows a weak negative correlation between the proportion of Immigrants from Western Asia and labor force participation rate among population between the ages 35 and 44 in the United States with a correlation coefficient (R) of -0.232 and weighted average of 83.8%. Similarly, the statistical analysis conducted on geographies consisting of 93,996,645 people shows a poor positive correlation between the proportion of Ugandans and labor force participation rate among population between the ages 35 and 44 in the United States with a correlation coefficient (R) of 0.135 and weighted average of 85.3%, a difference of 1.8%.
In Labor Force | Age 35-44 Correlation Summary
| Measurement | Immigrants from Western Asia | Ugandan |
| Minimum | 56.5% | 75.6% |
| Maximum | 100.0% | 100.0% |
| Range | 43.5% | 24.4% |
| Mean | 82.2% | 87.5% |
| Median | 83.6% | 87.1% |
| Interquartile 25% (IQ1) | 81.0% | 84.0% |
| Interquartile 75% (IQ3) | 84.9% | 91.4% |
| Interquartile Range (IQR) | 3.9% | 7.4% |
| Standard Deviation (Sample) | 7.7% | 5.9% |
| Standard Deviation (Population) | 7.7% | 5.9% |
Similar Demographics by In Labor Force | Age 35-44
Demographics Similar to Immigrants from Western Asia by In Labor Force | Age 35-44
In terms of in labor force | age 35-44, the demographic groups most similar to Immigrants from Western Asia are Immigrants from Cambodia (83.8%, a difference of 0.0%), Guyanese (83.8%, a difference of 0.0%), Malaysian (83.8%, a difference of 0.0%), Immigrants (83.7%, a difference of 0.020%), and Celtic (83.8%, a difference of 0.030%).
| Demographics | Rating | Rank | In Labor Force | Age 35-44 |
| West Indians | 2.4 /100 | #236 | Tragic 83.9% |
| English | 1.8 /100 | #237 | Tragic 83.8% |
| Immigrants | Laos | 1.7 /100 | #238 | Tragic 83.8% |
| Celtics | 1.4 /100 | #239 | Tragic 83.8% |
| Arabs | 1.3 /100 | #240 | Tragic 83.8% |
| Iraqis | 1.3 /100 | #241 | Tragic 83.8% |
| Immigrants | Cambodia | 1.1 /100 | #242 | Tragic 83.8% |
| Immigrants | Western Asia | 1.1 /100 | #243 | Tragic 83.8% |
| Guyanese | 1.1 /100 | #244 | Tragic 83.8% |
| Malaysians | 1.1 /100 | #245 | Tragic 83.8% |
| Immigrants | Immigrants | 1.0 /100 | #246 | Tragic 83.7% |
| Immigrants | Armenia | 0.9 /100 | #247 | Tragic 83.7% |
| Indonesians | 0.8 /100 | #248 | Tragic 83.7% |
| Immigrants | St. Vincent and the Grenadines | 0.7 /100 | #249 | Tragic 83.7% |
| Whites/Caucasians | 0.5 /100 | #250 | Tragic 83.6% |
Demographics Similar to Ugandans by In Labor Force | Age 35-44
In terms of in labor force | age 35-44, the demographic groups most similar to Ugandans are Bermudan (85.3%, a difference of 0.010%), Czech (85.3%, a difference of 0.010%), Immigrants from India (85.3%, a difference of 0.010%), Immigrants from Nepal (85.3%, a difference of 0.020%), and Cambodian (85.3%, a difference of 0.030%).
| Demographics | Rating | Rank | In Labor Force | Age 35-44 |
| Immigrants | Liberia | 99.9 /100 | #26 | Exceptional 85.4% |
| Immigrants | Lithuania | 99.9 /100 | #27 | Exceptional 85.4% |
| Immigrants | Greece | 99.9 /100 | #28 | Exceptional 85.3% |
| Cambodians | 99.9 /100 | #29 | Exceptional 85.3% |
| Bermudans | 99.9 /100 | #30 | Exceptional 85.3% |
| Czechs | 99.9 /100 | #31 | Exceptional 85.3% |
| Immigrants | India | 99.9 /100 | #32 | Exceptional 85.3% |
| Ugandans | 99.9 /100 | #33 | Exceptional 85.3% |
| Immigrants | Nepal | 99.9 /100 | #34 | Exceptional 85.3% |
| Estonians | 99.9 /100 | #35 | Exceptional 85.3% |
| Immigrants | Morocco | 99.8 /100 | #36 | Exceptional 85.2% |
| Kenyans | 99.8 /100 | #37 | Exceptional 85.2% |
| Immigrants | Poland | 99.8 /100 | #38 | Exceptional 85.2% |
| Eastern Europeans | 99.8 /100 | #39 | Exceptional 85.2% |
| Immigrants | Bulgaria | 99.8 /100 | #40 | Exceptional 85.2% |