Immigrants from Western Asia vs Immigrants from Netherlands In Labor Force | Age 35-44
COMPARE
Immigrants from Western Asia
Immigrants from Netherlands
In Labor Force | Age 35-44
In Labor Force | Age 35-44 Comparison
Immigrants from Western Asia
Immigrants from Netherlands
83.8%
IN LABOR FORCE | AGE 35-44
1.1/ 100
METRIC RATING
243rd/ 347
METRIC RANK
84.5%
IN LABOR FORCE | AGE 35-44
76.6/ 100
METRIC RATING
147th/ 347
METRIC RANK
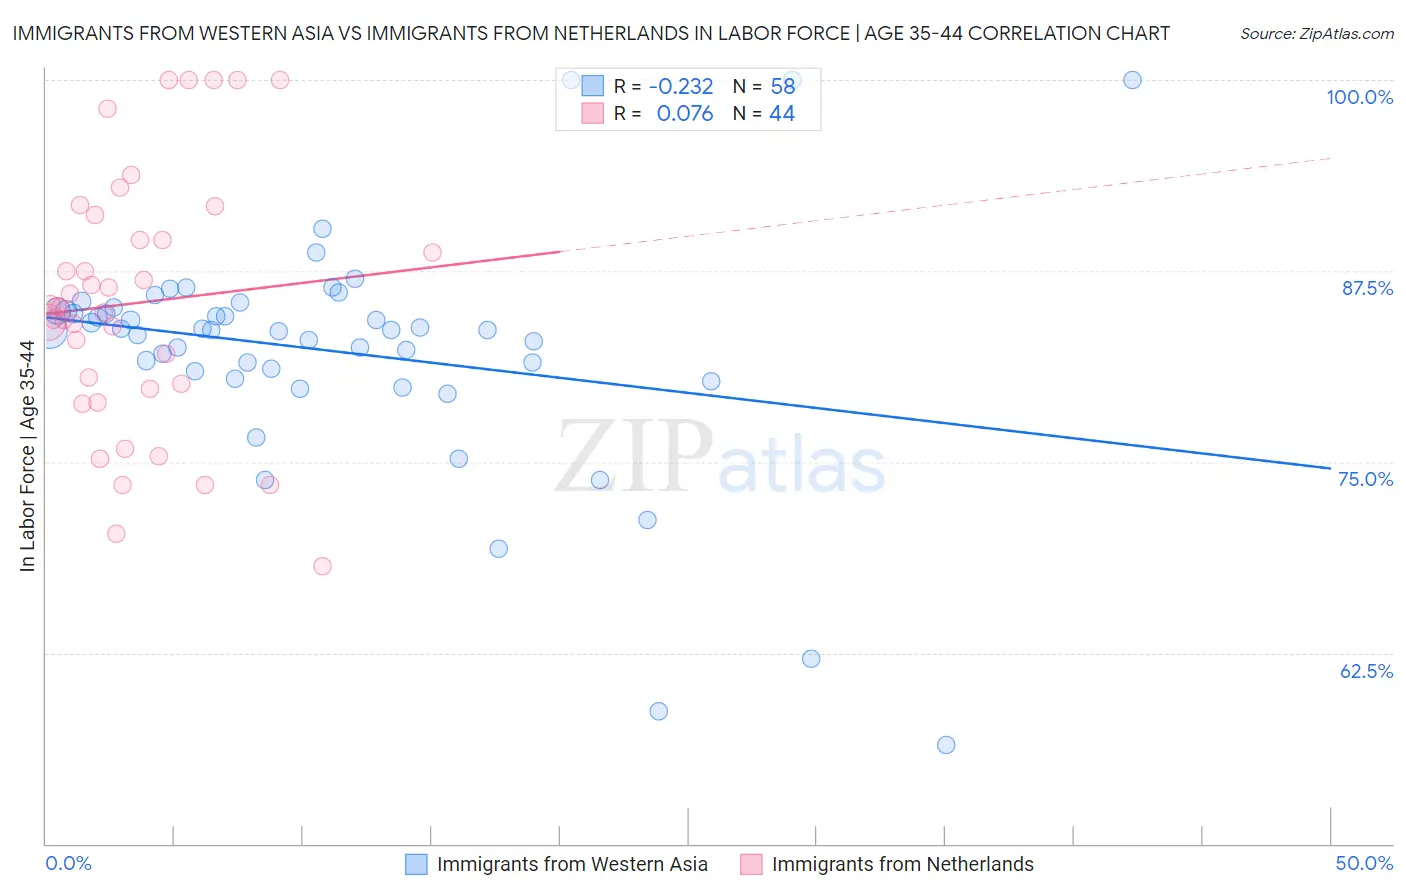
Immigrants from Western Asia vs Immigrants from Netherlands In Labor Force | Age 35-44 Correlation Chart
The statistical analysis conducted on geographies consisting of 404,178,045 people shows a weak negative correlation between the proportion of Immigrants from Western Asia and labor force participation rate among population between the ages 35 and 44 in the United States with a correlation coefficient (R) of -0.232 and weighted average of 83.8%. Similarly, the statistical analysis conducted on geographies consisting of 237,801,215 people shows a slight positive correlation between the proportion of Immigrants from Netherlands and labor force participation rate among population between the ages 35 and 44 in the United States with a correlation coefficient (R) of 0.076 and weighted average of 84.5%, a difference of 0.92%.
In Labor Force | Age 35-44 Correlation Summary
| Measurement | Immigrants from Western Asia | Immigrants from Netherlands |
| Minimum | 56.5% | 68.2% |
| Maximum | 100.0% | 100.0% |
| Range | 43.5% | 31.8% |
| Mean | 82.2% | 85.4% |
| Median | 83.6% | 85.1% |
| Interquartile 25% (IQ1) | 81.0% | 80.0% |
| Interquartile 75% (IQ3) | 84.9% | 90.3% |
| Interquartile Range (IQR) | 3.9% | 10.3% |
| Standard Deviation (Sample) | 7.7% | 8.3% |
| Standard Deviation (Population) | 7.7% | 8.2% |
Similar Demographics by In Labor Force | Age 35-44
Demographics Similar to Immigrants from Western Asia by In Labor Force | Age 35-44
In terms of in labor force | age 35-44, the demographic groups most similar to Immigrants from Western Asia are Immigrants from Cambodia (83.8%, a difference of 0.0%), Guyanese (83.8%, a difference of 0.0%), Malaysian (83.8%, a difference of 0.0%), Immigrants (83.7%, a difference of 0.020%), and Celtic (83.8%, a difference of 0.030%).
| Demographics | Rating | Rank | In Labor Force | Age 35-44 |
| West Indians | 2.4 /100 | #236 | Tragic 83.9% |
| English | 1.8 /100 | #237 | Tragic 83.8% |
| Immigrants | Laos | 1.7 /100 | #238 | Tragic 83.8% |
| Celtics | 1.4 /100 | #239 | Tragic 83.8% |
| Arabs | 1.3 /100 | #240 | Tragic 83.8% |
| Iraqis | 1.3 /100 | #241 | Tragic 83.8% |
| Immigrants | Cambodia | 1.1 /100 | #242 | Tragic 83.8% |
| Immigrants | Western Asia | 1.1 /100 | #243 | Tragic 83.8% |
| Guyanese | 1.1 /100 | #244 | Tragic 83.8% |
| Malaysians | 1.1 /100 | #245 | Tragic 83.8% |
| Immigrants | Immigrants | 1.0 /100 | #246 | Tragic 83.7% |
| Immigrants | Armenia | 0.9 /100 | #247 | Tragic 83.7% |
| Indonesians | 0.8 /100 | #248 | Tragic 83.7% |
| Immigrants | St. Vincent and the Grenadines | 0.7 /100 | #249 | Tragic 83.7% |
| Whites/Caucasians | 0.5 /100 | #250 | Tragic 83.6% |
Demographics Similar to Immigrants from Netherlands by In Labor Force | Age 35-44
In terms of in labor force | age 35-44, the demographic groups most similar to Immigrants from Netherlands are Immigrants from Asia (84.5%, a difference of 0.020%), Immigrants from Uruguay (84.6%, a difference of 0.030%), Immigrants from Ukraine (84.6%, a difference of 0.030%), Immigrants from Jamaica (84.6%, a difference of 0.030%), and Immigrants from Saudi Arabia (84.6%, a difference of 0.030%).
| Demographics | Rating | Rank | In Labor Force | Age 35-44 |
| Immigrants | Japan | 81.4 /100 | #140 | Excellent 84.6% |
| Immigrants | Belgium | 80.8 /100 | #141 | Excellent 84.6% |
| Immigrants | Uruguay | 80.1 /100 | #142 | Excellent 84.6% |
| Immigrants | Ukraine | 79.7 /100 | #143 | Good 84.6% |
| Immigrants | Jamaica | 79.4 /100 | #144 | Good 84.6% |
| Immigrants | Saudi Arabia | 79.4 /100 | #145 | Good 84.6% |
| Immigrants | Asia | 78.7 /100 | #146 | Good 84.5% |
| Immigrants | Netherlands | 76.6 /100 | #147 | Good 84.5% |
| South American Indians | 73.6 /100 | #148 | Good 84.5% |
| Okinawans | 73.5 /100 | #149 | Good 84.5% |
| Immigrants | Nigeria | 73.3 /100 | #150 | Good 84.5% |
| Romanians | 72.1 /100 | #151 | Good 84.5% |
| Immigrants | Taiwan | 71.4 /100 | #152 | Good 84.5% |
| Trinidadians and Tobagonians | 69.5 /100 | #153 | Good 84.5% |
| Iranians | 69.4 /100 | #154 | Good 84.5% |