Immigrants from Venezuela vs Taiwanese In Labor Force | Age 20-24
COMPARE
Immigrants from Venezuela
Taiwanese
In Labor Force | Age 20-24
In Labor Force | Age 20-24 Comparison
Immigrants from Venezuela
Taiwanese
73.2%
IN LABOR FORCE | AGE 20-24
0.1/ 100
METRIC RATING
281st/ 347
METRIC RANK
74.7%
IN LABOR FORCE | AGE 20-24
23.2/ 100
METRIC RATING
199th/ 347
METRIC RANK
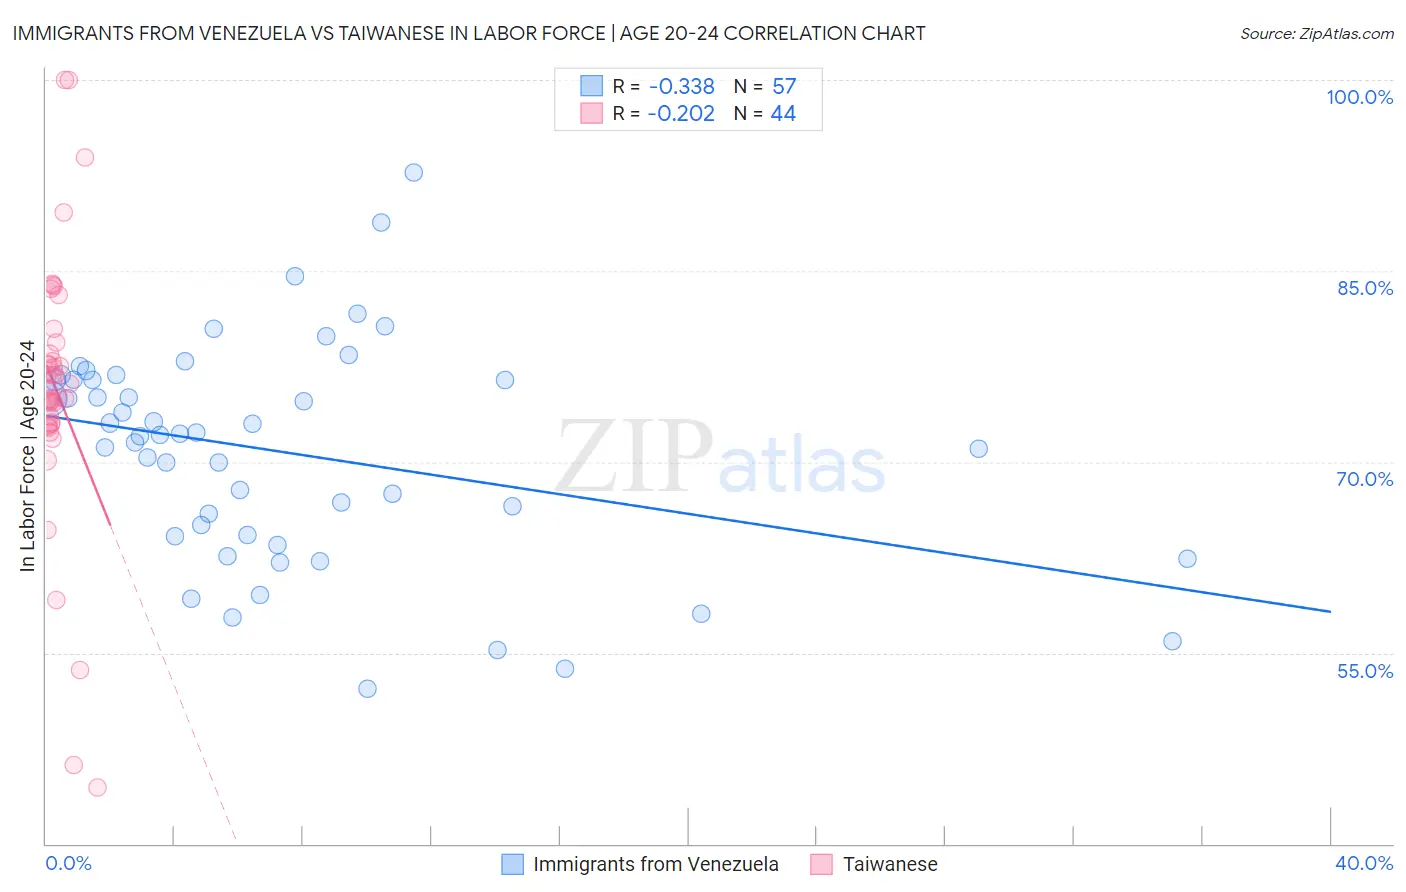
Immigrants from Venezuela vs Taiwanese In Labor Force | Age 20-24 Correlation Chart
The statistical analysis conducted on geographies consisting of 287,836,016 people shows a mild negative correlation between the proportion of Immigrants from Venezuela and labor force participation rate among population between the ages 20 and 24 in the United States with a correlation coefficient (R) of -0.338 and weighted average of 73.2%. Similarly, the statistical analysis conducted on geographies consisting of 31,724,936 people shows a weak negative correlation between the proportion of Taiwanese and labor force participation rate among population between the ages 20 and 24 in the United States with a correlation coefficient (R) of -0.202 and weighted average of 74.7%, a difference of 2.0%.
In Labor Force | Age 20-24 Correlation Summary
| Measurement | Immigrants from Venezuela | Taiwanese |
| Minimum | 52.2% | 44.4% |
| Maximum | 92.7% | 100.0% |
| Range | 40.5% | 55.6% |
| Mean | 70.7% | 75.7% |
| Median | 72.1% | 75.4% |
| Interquartile 25% (IQ1) | 64.2% | 73.0% |
| Interquartile 75% (IQ3) | 76.5% | 78.9% |
| Interquartile Range (IQR) | 12.2% | 6.0% |
| Standard Deviation (Sample) | 8.6% | 10.7% |
| Standard Deviation (Population) | 8.5% | 10.6% |
Similar Demographics by In Labor Force | Age 20-24
Demographics Similar to Immigrants from Venezuela by In Labor Force | Age 20-24
In terms of in labor force | age 20-24, the demographic groups most similar to Immigrants from Venezuela are Immigrants from Spain (73.2%, a difference of 0.010%), Immigrants from Bahamas (73.2%, a difference of 0.010%), Bahamian (73.3%, a difference of 0.030%), Kiowa (73.2%, a difference of 0.040%), and Nicaraguan (73.2%, a difference of 0.090%).
| Demographics | Rating | Rank | In Labor Force | Age 20-24 |
| Immigrants | Colombia | 0.2 /100 | #274 | Tragic 73.4% |
| Immigrants | South America | 0.2 /100 | #275 | Tragic 73.3% |
| Mongolians | 0.2 /100 | #276 | Tragic 73.3% |
| Immigrants | Malaysia | 0.2 /100 | #277 | Tragic 73.3% |
| Cypriots | 0.2 /100 | #278 | Tragic 73.3% |
| Venezuelans | 0.2 /100 | #279 | Tragic 73.3% |
| Bahamians | 0.1 /100 | #280 | Tragic 73.3% |
| Immigrants | Venezuela | 0.1 /100 | #281 | Tragic 73.2% |
| Immigrants | Spain | 0.1 /100 | #282 | Tragic 73.2% |
| Immigrants | Bahamas | 0.1 /100 | #283 | Tragic 73.2% |
| Kiowa | 0.1 /100 | #284 | Tragic 73.2% |
| Nicaraguans | 0.1 /100 | #285 | Tragic 73.2% |
| Immigrants | Lebanon | 0.1 /100 | #286 | Tragic 73.1% |
| Immigrants | Korea | 0.1 /100 | #287 | Tragic 73.1% |
| Argentineans | 0.1 /100 | #288 | Tragic 73.1% |
Demographics Similar to Taiwanese by In Labor Force | Age 20-24
In terms of in labor force | age 20-24, the demographic groups most similar to Taiwanese are Immigrants from Nigeria (74.7%, a difference of 0.020%), Nigerian (74.7%, a difference of 0.030%), Eastern European (74.8%, a difference of 0.040%), Immigrants from Vietnam (74.7%, a difference of 0.040%), and Panamanian (74.7%, a difference of 0.040%).
| Demographics | Rating | Rank | In Labor Force | Age 20-24 |
| Immigrants | Europe | 27.5 /100 | #192 | Fair 74.8% |
| Alsatians | 27.1 /100 | #193 | Fair 74.8% |
| Immigrants | Denmark | 25.8 /100 | #194 | Fair 74.8% |
| Eastern Europeans | 25.4 /100 | #195 | Fair 74.8% |
| Immigrants | Vietnam | 25.1 /100 | #196 | Fair 74.7% |
| Panamanians | 25.0 /100 | #197 | Fair 74.7% |
| Immigrants | Nigeria | 24.2 /100 | #198 | Fair 74.7% |
| Taiwanese | 23.2 /100 | #199 | Fair 74.7% |
| Nigerians | 21.9 /100 | #200 | Fair 74.7% |
| Choctaw | 21.4 /100 | #201 | Fair 74.7% |
| Moroccans | 20.4 /100 | #202 | Fair 74.7% |
| Immigrants | Northern Africa | 17.9 /100 | #203 | Poor 74.6% |
| Immigrants | Italy | 17.6 /100 | #204 | Poor 74.6% |
| Inupiat | 17.6 /100 | #205 | Poor 74.6% |
| Sioux | 17.5 /100 | #206 | Poor 74.6% |