Immigrants from Fiji vs Taiwanese In Labor Force | Age 20-24
COMPARE
Immigrants from Fiji
Taiwanese
In Labor Force | Age 20-24
In Labor Force | Age 20-24 Comparison
Immigrants from Fiji
Taiwanese
74.3%
IN LABOR FORCE | AGE 20-24
5.9/ 100
METRIC RATING
226th/ 347
METRIC RANK
74.7%
IN LABOR FORCE | AGE 20-24
23.2/ 100
METRIC RATING
199th/ 347
METRIC RANK
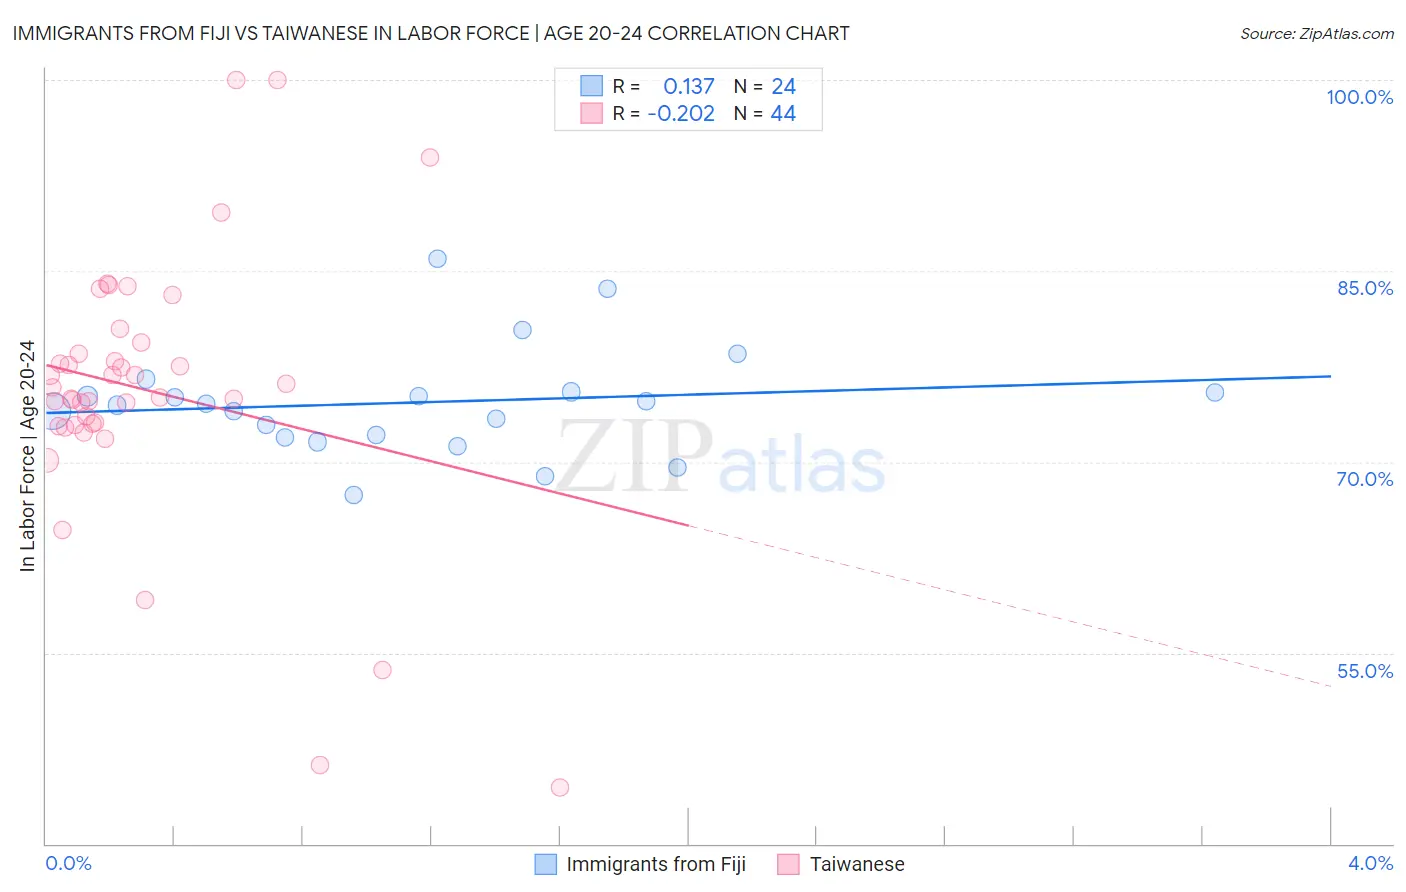
Immigrants from Fiji vs Taiwanese In Labor Force | Age 20-24 Correlation Chart
The statistical analysis conducted on geographies consisting of 93,752,129 people shows a poor positive correlation between the proportion of Immigrants from Fiji and labor force participation rate among population between the ages 20 and 24 in the United States with a correlation coefficient (R) of 0.137 and weighted average of 74.3%. Similarly, the statistical analysis conducted on geographies consisting of 31,724,936 people shows a weak negative correlation between the proportion of Taiwanese and labor force participation rate among population between the ages 20 and 24 in the United States with a correlation coefficient (R) of -0.202 and weighted average of 74.7%, a difference of 0.58%.
In Labor Force | Age 20-24 Correlation Summary
| Measurement | Immigrants from Fiji | Taiwanese |
| Minimum | 67.4% | 44.4% |
| Maximum | 86.0% | 100.0% |
| Range | 18.6% | 55.6% |
| Mean | 74.7% | 75.7% |
| Median | 74.5% | 75.4% |
| Interquartile 25% (IQ1) | 72.0% | 73.0% |
| Interquartile 75% (IQ3) | 75.5% | 78.9% |
| Interquartile Range (IQR) | 3.5% | 6.0% |
| Standard Deviation (Sample) | 4.2% | 10.7% |
| Standard Deviation (Population) | 4.2% | 10.6% |
Similar Demographics by In Labor Force | Age 20-24
Demographics Similar to Immigrants from Fiji by In Labor Force | Age 20-24
In terms of in labor force | age 20-24, the demographic groups most similar to Immigrants from Fiji are Immigrants from Ireland (74.3%, a difference of 0.010%), Ghanaian (74.3%, a difference of 0.020%), Seminole (74.3%, a difference of 0.060%), Immigrants from Ukraine (74.2%, a difference of 0.060%), and Immigrants from Sweden (74.2%, a difference of 0.090%).
| Demographics | Rating | Rank | In Labor Force | Age 20-24 |
| Nepalese | 10.5 /100 | #219 | Poor 74.5% |
| Immigrants | Norway | 10.3 /100 | #220 | Poor 74.5% |
| Chickasaw | 10.3 /100 | #221 | Poor 74.5% |
| Immigrants | India | 9.9 /100 | #222 | Tragic 74.4% |
| Hispanics or Latinos | 7.9 /100 | #223 | Tragic 74.4% |
| Seminole | 6.9 /100 | #224 | Tragic 74.3% |
| Ghanaians | 6.2 /100 | #225 | Tragic 74.3% |
| Immigrants | Fiji | 5.9 /100 | #226 | Tragic 74.3% |
| Immigrants | Ireland | 5.8 /100 | #227 | Tragic 74.3% |
| Immigrants | Ukraine | 5.1 /100 | #228 | Tragic 74.2% |
| Immigrants | Sweden | 4.6 /100 | #229 | Tragic 74.2% |
| Immigrants | Albania | 4.3 /100 | #230 | Tragic 74.2% |
| Immigrants | Greece | 4.1 /100 | #231 | Tragic 74.2% |
| Immigrants | Switzerland | 4.1 /100 | #232 | Tragic 74.2% |
| Immigrants | Chile | 3.7 /100 | #233 | Tragic 74.1% |
Demographics Similar to Taiwanese by In Labor Force | Age 20-24
In terms of in labor force | age 20-24, the demographic groups most similar to Taiwanese are Immigrants from Nigeria (74.7%, a difference of 0.020%), Nigerian (74.7%, a difference of 0.030%), Eastern European (74.8%, a difference of 0.040%), Immigrants from Vietnam (74.7%, a difference of 0.040%), and Panamanian (74.7%, a difference of 0.040%).
| Demographics | Rating | Rank | In Labor Force | Age 20-24 |
| Immigrants | Europe | 27.5 /100 | #192 | Fair 74.8% |
| Alsatians | 27.1 /100 | #193 | Fair 74.8% |
| Immigrants | Denmark | 25.8 /100 | #194 | Fair 74.8% |
| Eastern Europeans | 25.4 /100 | #195 | Fair 74.8% |
| Immigrants | Vietnam | 25.1 /100 | #196 | Fair 74.7% |
| Panamanians | 25.0 /100 | #197 | Fair 74.7% |
| Immigrants | Nigeria | 24.2 /100 | #198 | Fair 74.7% |
| Taiwanese | 23.2 /100 | #199 | Fair 74.7% |
| Nigerians | 21.9 /100 | #200 | Fair 74.7% |
| Choctaw | 21.4 /100 | #201 | Fair 74.7% |
| Moroccans | 20.4 /100 | #202 | Fair 74.7% |
| Immigrants | Northern Africa | 17.9 /100 | #203 | Poor 74.6% |
| Immigrants | Italy | 17.6 /100 | #204 | Poor 74.6% |
| Inupiat | 17.6 /100 | #205 | Poor 74.6% |
| Sioux | 17.5 /100 | #206 | Poor 74.6% |