Immigrants from Taiwan vs Jamaican In Labor Force | Age 20-24
COMPARE
Immigrants from Taiwan
Jamaican
In Labor Force | Age 20-24
In Labor Force | Age 20-24 Comparison
Immigrants from Taiwan
Jamaicans
71.5%
IN LABOR FORCE | AGE 20-24
0.0/ 100
METRIC RATING
321st/ 347
METRIC RANK
72.7%
IN LABOR FORCE | AGE 20-24
0.0/ 100
METRIC RATING
296th/ 347
METRIC RANK
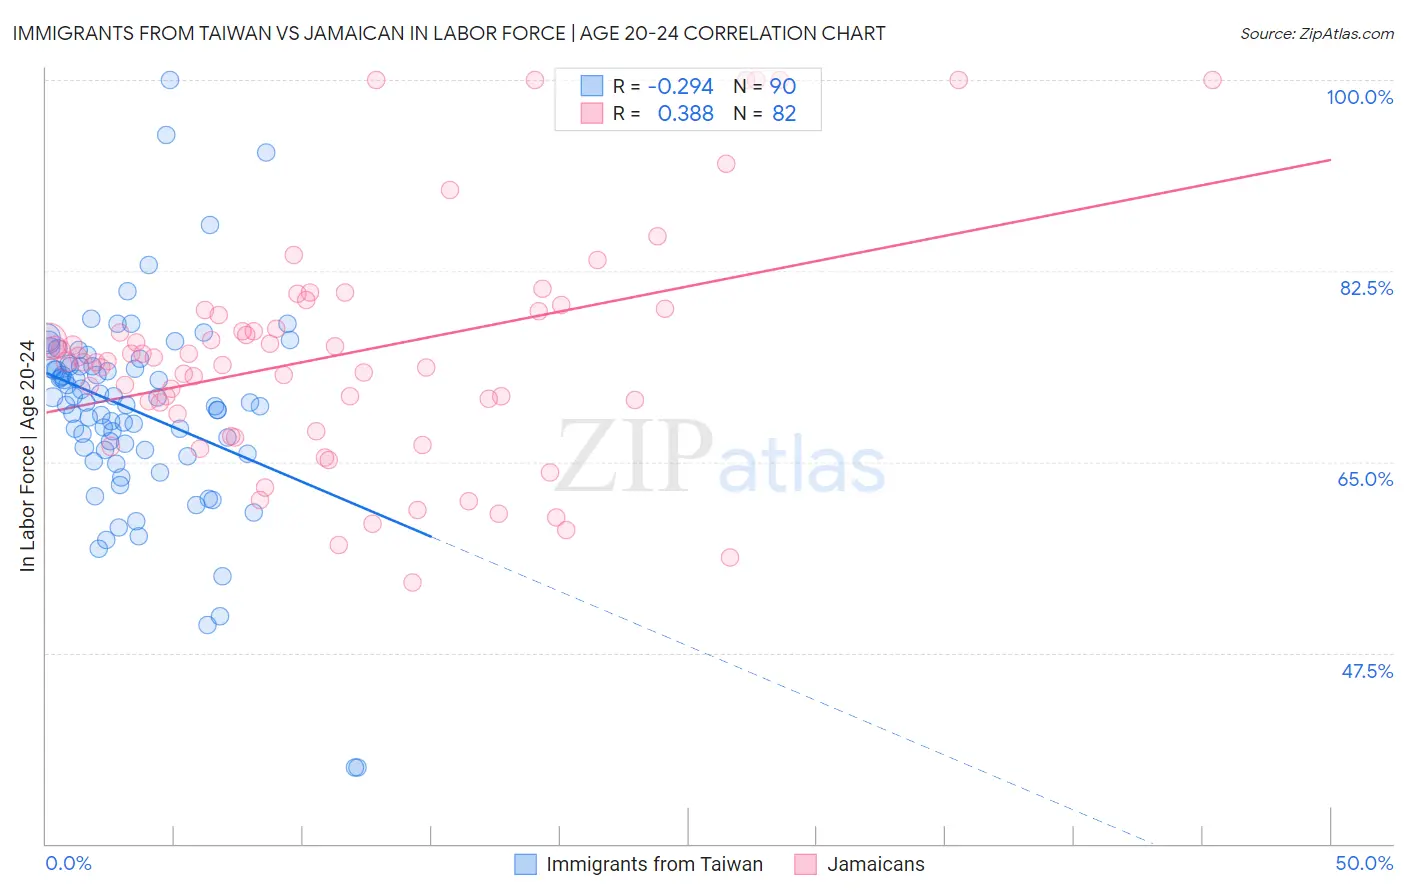
Immigrants from Taiwan vs Jamaican In Labor Force | Age 20-24 Correlation Chart
The statistical analysis conducted on geographies consisting of 298,185,323 people shows a weak negative correlation between the proportion of Immigrants from Taiwan and labor force participation rate among population between the ages 20 and 24 in the United States with a correlation coefficient (R) of -0.294 and weighted average of 71.5%. Similarly, the statistical analysis conducted on geographies consisting of 367,980,296 people shows a mild positive correlation between the proportion of Jamaicans and labor force participation rate among population between the ages 20 and 24 in the United States with a correlation coefficient (R) of 0.388 and weighted average of 72.7%, a difference of 1.7%.
In Labor Force | Age 20-24 Correlation Summary
| Measurement | Immigrants from Taiwan | Jamaican |
| Minimum | 37.0% | 54.0% |
| Maximum | 100.0% | 100.0% |
| Range | 63.0% | 46.0% |
| Mean | 69.7% | 74.8% |
| Median | 70.3% | 74.2% |
| Interquartile 25% (IQ1) | 66.1% | 69.5% |
| Interquartile 75% (IQ3) | 73.8% | 78.8% |
| Interquartile Range (IQR) | 7.7% | 9.3% |
| Standard Deviation (Sample) | 9.4% | 10.6% |
| Standard Deviation (Population) | 9.4% | 10.5% |
Similar Demographics by In Labor Force | Age 20-24
Demographics Similar to Immigrants from Taiwan by In Labor Force | Age 20-24
In terms of in labor force | age 20-24, the demographic groups most similar to Immigrants from Taiwan are Trinidadian and Tobagonian (71.5%, a difference of 0.050%), Immigrants from Israel (71.6%, a difference of 0.13%), Filipino (71.4%, a difference of 0.13%), Immigrants from Hong Kong (71.6%, a difference of 0.16%), and Immigrants from Armenia (71.7%, a difference of 0.25%).
| Demographics | Rating | Rank | In Labor Force | Age 20-24 |
| Indians (Asian) | 0.0 /100 | #314 | Tragic 71.9% |
| Immigrants | Iran | 0.0 /100 | #315 | Tragic 71.8% |
| Immigrants | Eastern Asia | 0.0 /100 | #316 | Tragic 71.8% |
| Immigrants | Armenia | 0.0 /100 | #317 | Tragic 71.7% |
| Immigrants | Hong Kong | 0.0 /100 | #318 | Tragic 71.6% |
| Immigrants | Israel | 0.0 /100 | #319 | Tragic 71.6% |
| Trinidadians and Tobagonians | 0.0 /100 | #320 | Tragic 71.5% |
| Immigrants | Taiwan | 0.0 /100 | #321 | Tragic 71.5% |
| Filipinos | 0.0 /100 | #322 | Tragic 71.4% |
| West Indians | 0.0 /100 | #323 | Tragic 71.3% |
| Immigrants | Dominican Republic | 0.0 /100 | #324 | Tragic 71.2% |
| Barbadians | 0.0 /100 | #325 | Tragic 71.1% |
| Dominicans | 0.0 /100 | #326 | Tragic 71.1% |
| Immigrants | Trinidad and Tobago | 0.0 /100 | #327 | Tragic 71.1% |
| Immigrants | China | 0.0 /100 | #328 | Tragic 71.1% |
Demographics Similar to Jamaicans by In Labor Force | Age 20-24
In terms of in labor force | age 20-24, the demographic groups most similar to Jamaicans are Okinawan (72.7%, a difference of 0.0%), Central American Indian (72.7%, a difference of 0.050%), Immigrants from Argentina (72.8%, a difference of 0.11%), Immigrants from Belize (72.8%, a difference of 0.14%), and Israeli (72.6%, a difference of 0.17%).
| Demographics | Rating | Rank | In Labor Force | Age 20-24 |
| U.S. Virgin Islanders | 0.1 /100 | #289 | Tragic 73.0% |
| Immigrants | Belarus | 0.1 /100 | #290 | Tragic 73.0% |
| Immigrants | Nicaragua | 0.0 /100 | #291 | Tragic 72.9% |
| Pueblo | 0.0 /100 | #292 | Tragic 72.9% |
| Immigrants | Belize | 0.0 /100 | #293 | Tragic 72.8% |
| Immigrants | Argentina | 0.0 /100 | #294 | Tragic 72.8% |
| Okinawans | 0.0 /100 | #295 | Tragic 72.7% |
| Jamaicans | 0.0 /100 | #296 | Tragic 72.7% |
| Central American Indians | 0.0 /100 | #297 | Tragic 72.7% |
| Israelis | 0.0 /100 | #298 | Tragic 72.6% |
| Iranians | 0.0 /100 | #299 | Tragic 72.6% |
| Armenians | 0.0 /100 | #300 | Tragic 72.5% |
| Cubans | 0.0 /100 | #301 | Tragic 72.5% |
| Natives/Alaskans | 0.0 /100 | #302 | Tragic 72.4% |
| Ecuadorians | 0.0 /100 | #303 | Tragic 72.4% |