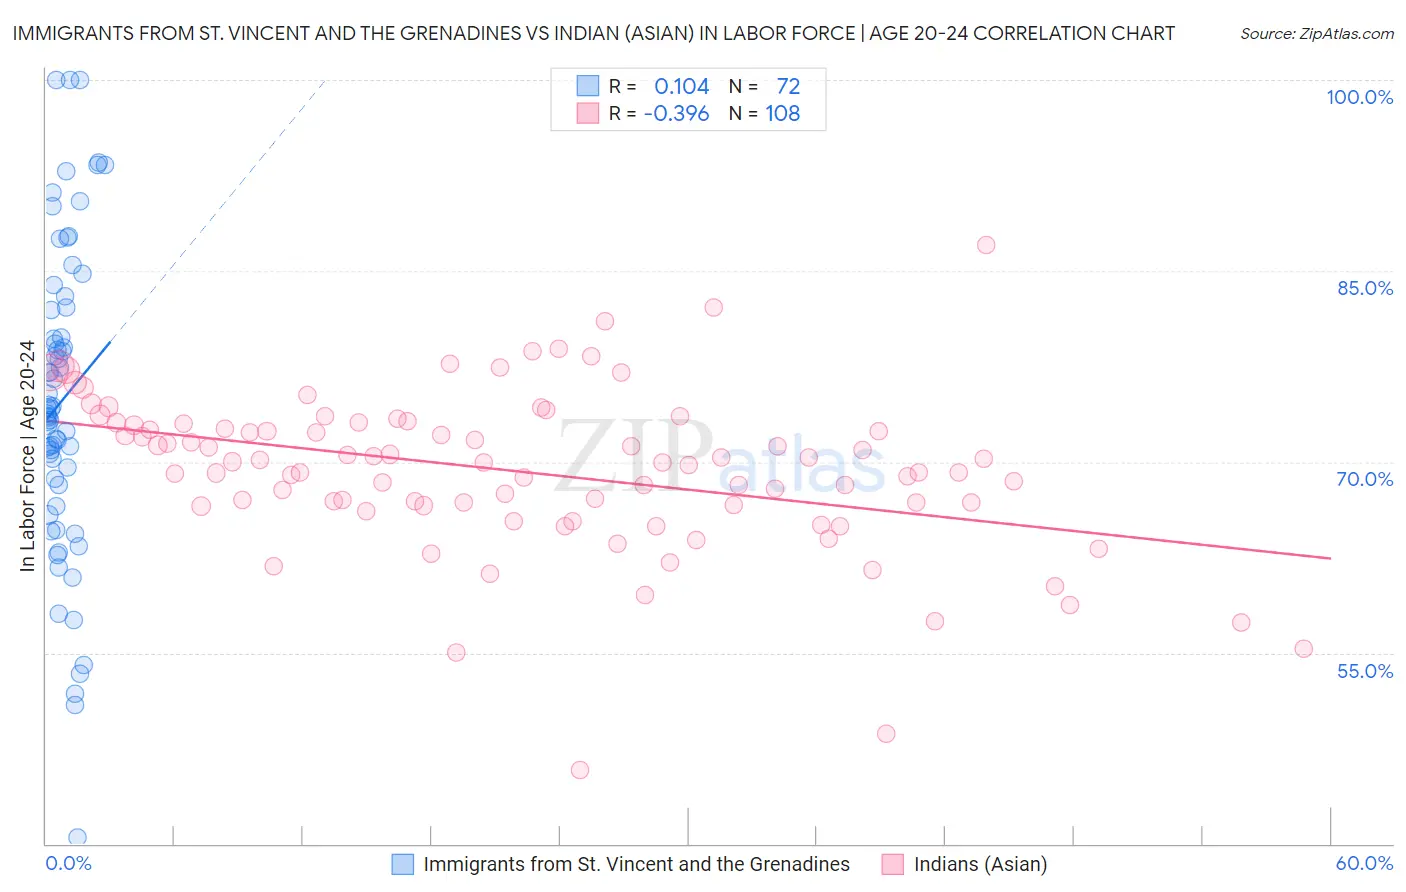
Immigrants from St. Vincent and the Grenadines vs Indian (Asian) In Labor Force | Age 20-24
COMPARE
Immigrants from St. Vincent and the Grenadines
Indian (Asian)
In Labor Force | Age 20-24
In Labor Force | Age 20-24 Comparison
Immigrants from St. Vincent and the Grenadines
Indians (Asian)
68.4%
IN LABOR FORCE | AGE 20-24
0.0/ 100
METRIC RATING
342nd/ 347
METRIC RANK
71.9%
IN LABOR FORCE | AGE 20-24
0.0/ 100
METRIC RATING
314th/ 347
METRIC RANK
Immigrants from St. Vincent and the Grenadines vs Indian (Asian) In Labor Force | Age 20-24 Correlation Chart
The statistical analysis conducted on geographies consisting of 56,193,829 people shows a poor positive correlation between the proportion of Immigrants from St. Vincent and the Grenadines and labor force participation rate among population between the ages 20 and 24 in the United States with a correlation coefficient (R) of 0.104 and weighted average of 68.4%. Similarly, the statistical analysis conducted on geographies consisting of 495,002,226 people shows a mild negative correlation between the proportion of Indians (Asian) and labor force participation rate among population between the ages 20 and 24 in the United States with a correlation coefficient (R) of -0.396 and weighted average of 71.9%, a difference of 5.1%.
In Labor Force | Age 20-24 Correlation Summary
| Measurement | Immigrants from St. Vincent and the Grenadines | Indian (Asian) |
| Minimum | 40.5% | 45.8% |
| Maximum | 100.0% | 87.0% |
| Range | 59.5% | 41.2% |
| Mean | 74.8% | 69.2% |
| Median | 74.0% | 70.0% |
| Interquartile 25% (IQ1) | 68.4% | 66.6% |
| Interquartile 75% (IQ3) | 82.0% | 72.9% |
| Interquartile Range (IQR) | 13.6% | 6.4% |
| Standard Deviation (Sample) | 12.1% | 6.3% |
| Standard Deviation (Population) | 12.0% | 6.3% |
Similar Demographics by In Labor Force | Age 20-24
Demographics Similar to Immigrants from St. Vincent and the Grenadines by In Labor Force | Age 20-24
In terms of in labor force | age 20-24, the demographic groups most similar to Immigrants from St. Vincent and the Grenadines are Puerto Rican (68.3%, a difference of 0.12%), Tohono O'odham (68.6%, a difference of 0.31%), Menominee (68.7%, a difference of 0.44%), Immigrants from Yemen (68.9%, a difference of 0.75%), and Pima (69.0%, a difference of 0.88%).
| Demographics | Rating | Rank | In Labor Force | Age 20-24 |
| Yuman | 0.0 /100 | #333 | Tragic 70.3% |
| British West Indians | 0.0 /100 | #334 | Tragic 70.0% |
| Immigrants | Barbados | 0.0 /100 | #335 | Tragic 69.7% |
| Immigrants | Guyana | 0.0 /100 | #336 | Tragic 69.3% |
| Guyanese | 0.0 /100 | #337 | Tragic 69.2% |
| Pima | 0.0 /100 | #338 | Tragic 69.0% |
| Immigrants | Yemen | 0.0 /100 | #339 | Tragic 68.9% |
| Menominee | 0.0 /100 | #340 | Tragic 68.7% |
| Tohono O'odham | 0.0 /100 | #341 | Tragic 68.6% |
| Immigrants | St. Vincent and the Grenadines | 0.0 /100 | #342 | Tragic 68.4% |
| Puerto Ricans | 0.0 /100 | #343 | Tragic 68.3% |
| Immigrants | Grenada | 0.0 /100 | #344 | Tragic 67.2% |
| Hopi | 0.0 /100 | #345 | Tragic 66.0% |
| Lumbee | 0.0 /100 | #346 | Tragic 65.5% |
| Navajo | 0.0 /100 | #347 | Tragic 64.8% |
Demographics Similar to Indians (Asian) by In Labor Force | Age 20-24
In terms of in labor force | age 20-24, the demographic groups most similar to Indians (Asian) are Immigrants from Dominica (71.9%, a difference of 0.010%), Immigrants from Caribbean (71.9%, a difference of 0.060%), Immigrants from Iran (71.8%, a difference of 0.090%), Apache (72.0%, a difference of 0.13%), and Immigrants from Eastern Asia (71.8%, a difference of 0.13%).
| Demographics | Rating | Rank | In Labor Force | Age 20-24 |
| Immigrants | Ecuador | 0.0 /100 | #307 | Tragic 72.3% |
| Soviet Union | 0.0 /100 | #308 | Tragic 72.3% |
| Tsimshian | 0.0 /100 | #309 | Tragic 72.3% |
| Immigrants | Cuba | 0.0 /100 | #310 | Tragic 72.0% |
| Apache | 0.0 /100 | #311 | Tragic 72.0% |
| Immigrants | Caribbean | 0.0 /100 | #312 | Tragic 71.9% |
| Immigrants | Dominica | 0.0 /100 | #313 | Tragic 71.9% |
| Indians (Asian) | 0.0 /100 | #314 | Tragic 71.9% |
| Immigrants | Iran | 0.0 /100 | #315 | Tragic 71.8% |
| Immigrants | Eastern Asia | 0.0 /100 | #316 | Tragic 71.8% |
| Immigrants | Armenia | 0.0 /100 | #317 | Tragic 71.7% |
| Immigrants | Hong Kong | 0.0 /100 | #318 | Tragic 71.6% |
| Immigrants | Israel | 0.0 /100 | #319 | Tragic 71.6% |
| Trinidadians and Tobagonians | 0.0 /100 | #320 | Tragic 71.5% |
| Immigrants | Taiwan | 0.0 /100 | #321 | Tragic 71.5% |