Immigrants from Southern Europe vs Ghanaian In Labor Force | Age 30-34
COMPARE
Immigrants from Southern Europe
Ghanaian
In Labor Force | Age 30-34
In Labor Force | Age 30-34 Comparison
Immigrants from Southern Europe
Ghanaians
85.1%
IN LABOR FORCE | AGE 30-34
93.3/ 100
METRIC RATING
120th/ 347
METRIC RANK
85.4%
IN LABOR FORCE | AGE 30-34
99.4/ 100
METRIC RATING
66th/ 347
METRIC RANK
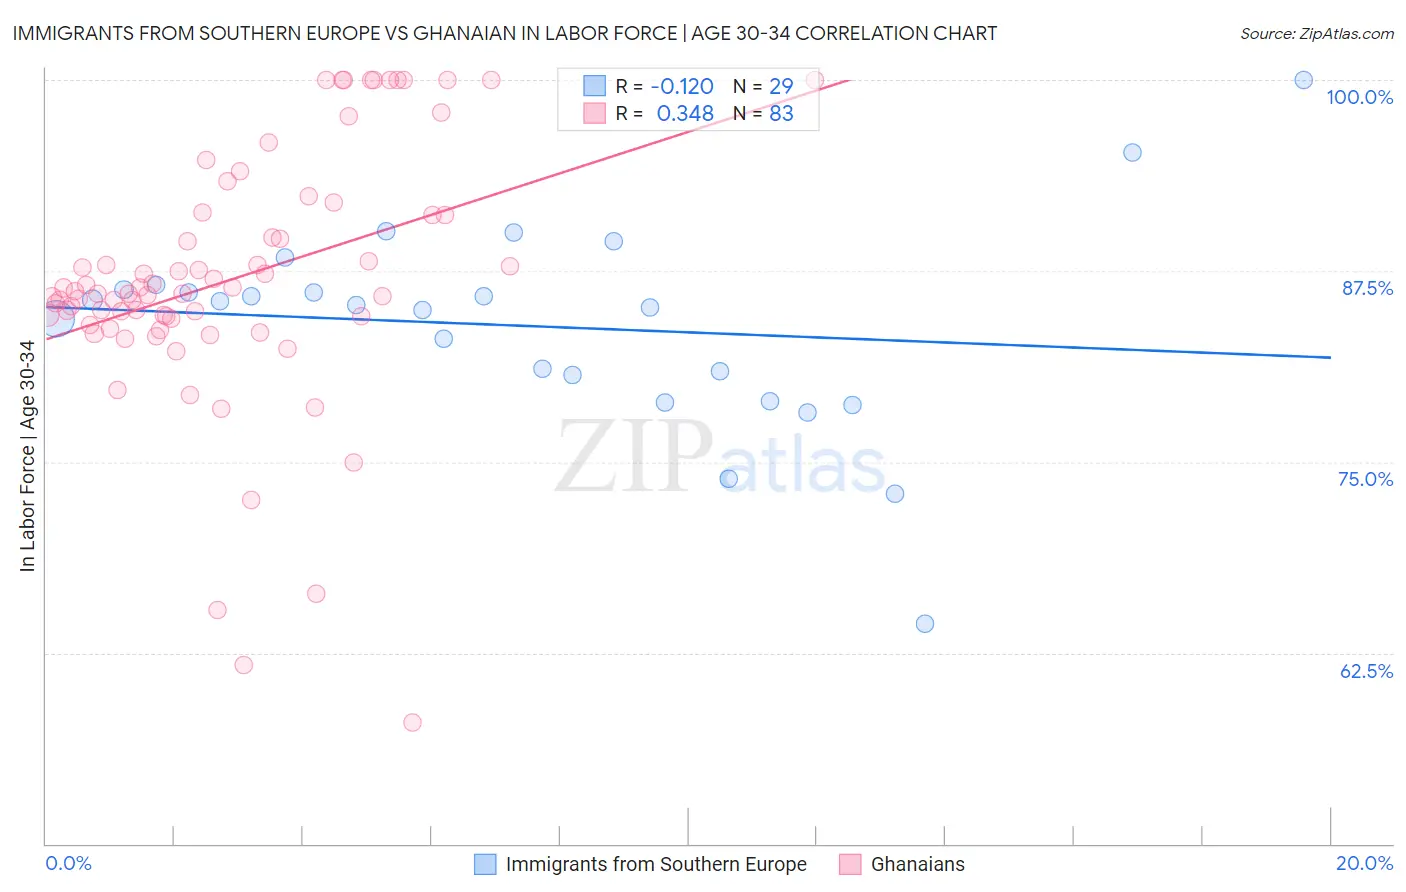
Immigrants from Southern Europe vs Ghanaian In Labor Force | Age 30-34 Correlation Chart
The statistical analysis conducted on geographies consisting of 402,565,184 people shows a poor negative correlation between the proportion of Immigrants from Southern Europe and labor force participation rate among population between the ages 30 and 34 in the United States with a correlation coefficient (R) of -0.120 and weighted average of 85.1%. Similarly, the statistical analysis conducted on geographies consisting of 190,577,100 people shows a mild positive correlation between the proportion of Ghanaians and labor force participation rate among population between the ages 30 and 34 in the United States with a correlation coefficient (R) of 0.348 and weighted average of 85.4%, a difference of 0.42%.
In Labor Force | Age 30-34 Correlation Summary
| Measurement | Immigrants from Southern Europe | Ghanaian |
| Minimum | 64.4% | 57.9% |
| Maximum | 100.0% | 100.0% |
| Range | 35.6% | 42.1% |
| Mean | 83.9% | 87.0% |
| Median | 85.3% | 86.0% |
| Interquartile 25% (IQ1) | 79.8% | 84.4% |
| Interquartile 75% (IQ3) | 86.4% | 91.2% |
| Interquartile Range (IQR) | 6.6% | 6.8% |
| Standard Deviation (Sample) | 6.8% | 8.3% |
| Standard Deviation (Population) | 6.7% | 8.3% |
Similar Demographics by In Labor Force | Age 30-34
Demographics Similar to Immigrants from Southern Europe by In Labor Force | Age 30-34
In terms of in labor force | age 30-34, the demographic groups most similar to Immigrants from Southern Europe are Asian (85.1%, a difference of 0.0%), Immigrants from Egypt (85.1%, a difference of 0.0%), Immigrants from Kuwait (85.1%, a difference of 0.020%), Immigrants from Denmark (85.1%, a difference of 0.030%), and Immigrants from Malaysia (85.1%, a difference of 0.030%).
| Demographics | Rating | Rank | In Labor Force | Age 30-34 |
| Immigrants | Romania | 94.7 /100 | #113 | Exceptional 85.1% |
| Yugoslavians | 94.7 /100 | #114 | Exceptional 85.1% |
| Immigrants | South Central Asia | 94.6 /100 | #115 | Exceptional 85.1% |
| Egyptians | 94.5 /100 | #116 | Exceptional 85.1% |
| Immigrants | Denmark | 94.3 /100 | #117 | Exceptional 85.1% |
| Immigrants | Malaysia | 94.2 /100 | #118 | Exceptional 85.1% |
| Asians | 93.4 /100 | #119 | Exceptional 85.1% |
| Immigrants | Southern Europe | 93.3 /100 | #120 | Exceptional 85.1% |
| Immigrants | Egypt | 93.2 /100 | #121 | Exceptional 85.1% |
| Immigrants | Kuwait | 92.6 /100 | #122 | Exceptional 85.1% |
| Armenians | 92.2 /100 | #123 | Exceptional 85.0% |
| Australians | 92.0 /100 | #124 | Exceptional 85.0% |
| Immigrants | Jordan | 91.5 /100 | #125 | Exceptional 85.0% |
| Austrians | 90.9 /100 | #126 | Exceptional 85.0% |
| Slavs | 90.7 /100 | #127 | Exceptional 85.0% |
Demographics Similar to Ghanaians by In Labor Force | Age 30-34
In terms of in labor force | age 30-34, the demographic groups most similar to Ghanaians are Kenyan (85.4%, a difference of 0.0%), Italian (85.4%, a difference of 0.010%), Senegalese (85.4%, a difference of 0.010%), Immigrants from Eastern Europe (85.4%, a difference of 0.010%), and Macedonian (85.5%, a difference of 0.020%).
| Demographics | Rating | Rank | In Labor Force | Age 30-34 |
| Immigrants | Poland | 99.5 /100 | #59 | Exceptional 85.5% |
| Immigrants | France | 99.5 /100 | #60 | Exceptional 85.5% |
| Immigrants | Brazil | 99.5 /100 | #61 | Exceptional 85.5% |
| Soviet Union | 99.4 /100 | #62 | Exceptional 85.5% |
| Macedonians | 99.4 /100 | #63 | Exceptional 85.5% |
| Italians | 99.4 /100 | #64 | Exceptional 85.4% |
| Senegalese | 99.4 /100 | #65 | Exceptional 85.4% |
| Ghanaians | 99.4 /100 | #66 | Exceptional 85.4% |
| Kenyans | 99.3 /100 | #67 | Exceptional 85.4% |
| Immigrants | Eastern Europe | 99.3 /100 | #68 | Exceptional 85.4% |
| Immigrants | Iran | 99.2 /100 | #69 | Exceptional 85.4% |
| Brazilians | 99.1 /100 | #70 | Exceptional 85.4% |
| Immigrants | Japan | 99.1 /100 | #71 | Exceptional 85.4% |
| Immigrants | China | 99.0 /100 | #72 | Exceptional 85.4% |
| Indians (Asian) | 99.0 /100 | #73 | Exceptional 85.4% |