Immigrants from Singapore vs Cape Verdean In Labor Force | Age 25-29
COMPARE
Immigrants from Singapore
Cape Verdean
In Labor Force | Age 25-29
In Labor Force | Age 25-29 Comparison
Immigrants from Singapore
Cape Verdeans
84.9%
IN LABOR FORCE | AGE 25-29
84.4/ 100
METRIC RATING
126th/ 347
METRIC RANK
86.0%
IN LABOR FORCE | AGE 25-29
100.0/ 100
METRIC RATING
19th/ 347
METRIC RANK
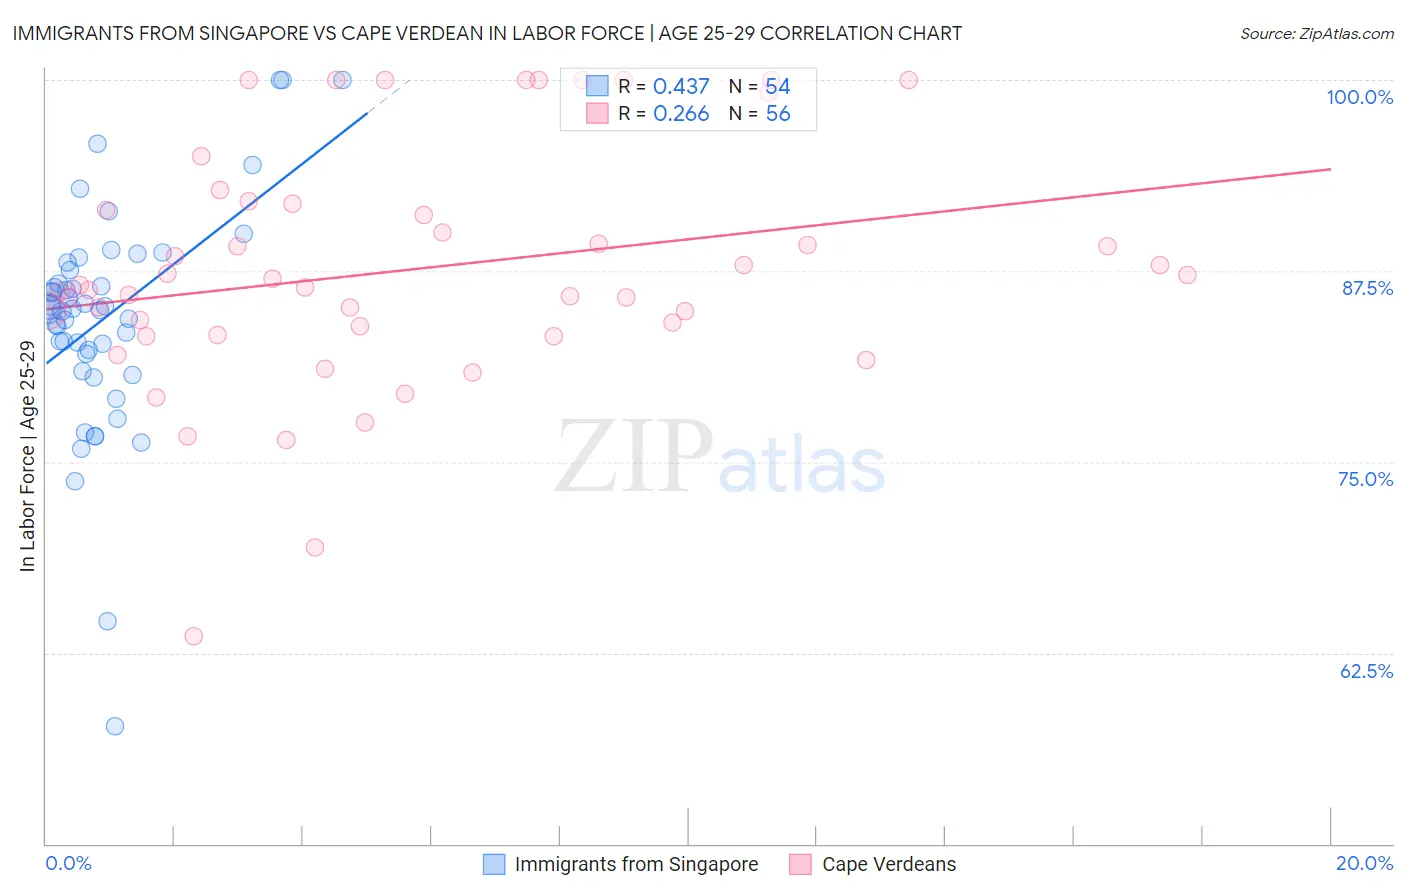
Immigrants from Singapore vs Cape Verdean In Labor Force | Age 25-29 Correlation Chart
The statistical analysis conducted on geographies consisting of 137,510,169 people shows a moderate positive correlation between the proportion of Immigrants from Singapore and labor force participation rate among population between the ages 25 and 29 in the United States with a correlation coefficient (R) of 0.437 and weighted average of 84.9%. Similarly, the statistical analysis conducted on geographies consisting of 107,562,545 people shows a weak positive correlation between the proportion of Cape Verdeans and labor force participation rate among population between the ages 25 and 29 in the United States with a correlation coefficient (R) of 0.266 and weighted average of 86.0%, a difference of 1.3%.
In Labor Force | Age 25-29 Correlation Summary
| Measurement | Immigrants from Singapore | Cape Verdean |
| Minimum | 57.7% | 63.6% |
| Maximum | 100.0% | 100.0% |
| Range | 42.3% | 36.4% |
| Mean | 84.4% | 87.6% |
| Median | 85.0% | 86.5% |
| Interquartile 25% (IQ1) | 82.1% | 83.6% |
| Interquartile 75% (IQ3) | 87.6% | 91.7% |
| Interquartile Range (IQR) | 5.5% | 8.1% |
| Standard Deviation (Sample) | 7.4% | 7.8% |
| Standard Deviation (Population) | 7.3% | 7.8% |
Similar Demographics by In Labor Force | Age 25-29
Demographics Similar to Immigrants from Singapore by In Labor Force | Age 25-29
In terms of in labor force | age 25-29, the demographic groups most similar to Immigrants from Singapore are Uruguayan (84.9%, a difference of 0.0%), Scandinavian (84.9%, a difference of 0.010%), Dutch (84.9%, a difference of 0.010%), Immigrants from Iran (84.9%, a difference of 0.010%), and Immigrants from Uruguay (84.9%, a difference of 0.010%).
| Demographics | Rating | Rank | In Labor Force | Age 25-29 |
| Filipinos | 87.1 /100 | #119 | Excellent 84.9% |
| Immigrants | South Africa | 86.1 /100 | #120 | Excellent 84.9% |
| Immigrants | Chile | 85.6 /100 | #121 | Excellent 84.9% |
| Scandinavians | 85.1 /100 | #122 | Excellent 84.9% |
| Dutch | 84.9 /100 | #123 | Excellent 84.9% |
| Immigrants | Iran | 84.8 /100 | #124 | Excellent 84.9% |
| Uruguayans | 84.7 /100 | #125 | Excellent 84.9% |
| Immigrants | Singapore | 84.4 /100 | #126 | Excellent 84.9% |
| Immigrants | Uruguay | 84.0 /100 | #127 | Excellent 84.9% |
| Australians | 83.6 /100 | #128 | Excellent 84.9% |
| Immigrants | Russia | 81.6 /100 | #129 | Excellent 84.9% |
| Northern Europeans | 81.3 /100 | #130 | Excellent 84.9% |
| Iranians | 78.1 /100 | #131 | Good 84.8% |
| Romanians | 77.7 /100 | #132 | Good 84.8% |
| Asians | 77.7 /100 | #133 | Good 84.8% |
Demographics Similar to Cape Verdeans by In Labor Force | Age 25-29
In terms of in labor force | age 25-29, the demographic groups most similar to Cape Verdeans are Bulgarian (86.0%, a difference of 0.010%), Immigrants from Ireland (86.0%, a difference of 0.010%), Maltese (86.0%, a difference of 0.020%), Bermudan (86.0%, a difference of 0.040%), and Cambodian (86.0%, a difference of 0.040%).
| Demographics | Rating | Rank | In Labor Force | Age 25-29 |
| Immigrants | Lithuania | 100.0 /100 | #12 | Exceptional 86.1% |
| Norwegians | 100.0 /100 | #13 | Exceptional 86.1% |
| Latvians | 100.0 /100 | #14 | Exceptional 86.1% |
| Bolivians | 100.0 /100 | #15 | Exceptional 86.1% |
| Immigrants | Bolivia | 100.0 /100 | #16 | Exceptional 86.1% |
| Bermudans | 100.0 /100 | #17 | Exceptional 86.0% |
| Bulgarians | 100.0 /100 | #18 | Exceptional 86.0% |
| Cape Verdeans | 100.0 /100 | #19 | Exceptional 86.0% |
| Immigrants | Ireland | 100.0 /100 | #20 | Exceptional 86.0% |
| Maltese | 100.0 /100 | #21 | Exceptional 86.0% |
| Cambodians | 100.0 /100 | #22 | Exceptional 86.0% |
| Immigrants | Uganda | 100.0 /100 | #23 | Exceptional 86.0% |
| Immigrants | Eastern Africa | 100.0 /100 | #24 | Exceptional 86.0% |
| Sudanese | 100.0 /100 | #25 | Exceptional 85.9% |
| Immigrants | North Macedonia | 100.0 /100 | #26 | Exceptional 85.9% |