Dominican vs Cape Verdean In Labor Force | Age 25-29
COMPARE
Dominican
Cape Verdean
In Labor Force | Age 25-29
In Labor Force | Age 25-29 Comparison
Dominicans
Cape Verdeans
83.2%
IN LABOR FORCE | AGE 25-29
0.0/ 100
METRIC RATING
280th/ 347
METRIC RANK
86.0%
IN LABOR FORCE | AGE 25-29
100.0/ 100
METRIC RATING
19th/ 347
METRIC RANK
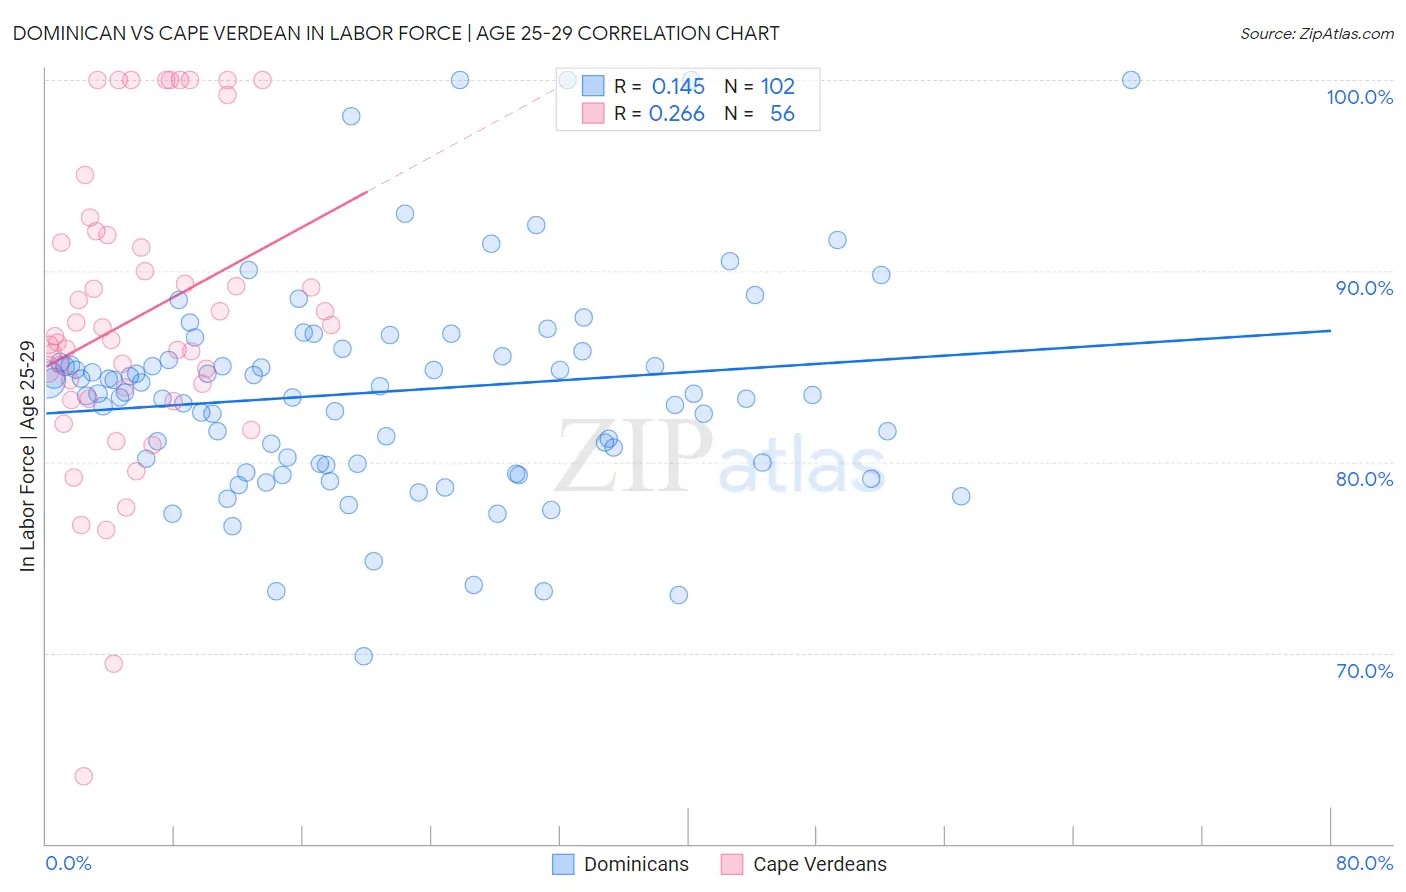
Dominican vs Cape Verdean In Labor Force | Age 25-29 Correlation Chart
The statistical analysis conducted on geographies consisting of 355,003,122 people shows a poor positive correlation between the proportion of Dominicans and labor force participation rate among population between the ages 25 and 29 in the United States with a correlation coefficient (R) of 0.145 and weighted average of 83.2%. Similarly, the statistical analysis conducted on geographies consisting of 107,562,545 people shows a weak positive correlation between the proportion of Cape Verdeans and labor force participation rate among population between the ages 25 and 29 in the United States with a correlation coefficient (R) of 0.266 and weighted average of 86.0%, a difference of 3.4%.
In Labor Force | Age 25-29 Correlation Summary
| Measurement | Dominican | Cape Verdean |
| Minimum | 69.8% | 63.6% |
| Maximum | 100.0% | 100.0% |
| Range | 30.2% | 36.4% |
| Mean | 83.7% | 87.6% |
| Median | 83.6% | 86.5% |
| Interquartile 25% (IQ1) | 79.9% | 83.6% |
| Interquartile 75% (IQ3) | 85.5% | 91.7% |
| Interquartile Range (IQR) | 5.6% | 8.1% |
| Standard Deviation (Sample) | 5.6% | 7.8% |
| Standard Deviation (Population) | 5.6% | 7.8% |
Similar Demographics by In Labor Force | Age 25-29
Demographics Similar to Dominicans by In Labor Force | Age 25-29
In terms of in labor force | age 25-29, the demographic groups most similar to Dominicans are British West Indian (83.2%, a difference of 0.020%), Immigrants from Cuba (83.2%, a difference of 0.030%), Immigrants from Dominican Republic (83.1%, a difference of 0.060%), American (83.1%, a difference of 0.070%), and Immigrants from the Azores (83.1%, a difference of 0.070%).
| Demographics | Rating | Rank | In Labor Force | Age 25-29 |
| Immigrants | Dominica | 0.0 /100 | #273 | Tragic 83.4% |
| Marshallese | 0.0 /100 | #274 | Tragic 83.3% |
| Samoans | 0.0 /100 | #275 | Tragic 83.3% |
| Immigrants | Honduras | 0.0 /100 | #276 | Tragic 83.3% |
| Africans | 0.0 /100 | #277 | Tragic 83.2% |
| Immigrants | Cuba | 0.0 /100 | #278 | Tragic 83.2% |
| British West Indians | 0.0 /100 | #279 | Tragic 83.2% |
| Dominicans | 0.0 /100 | #280 | Tragic 83.2% |
| Immigrants | Dominican Republic | 0.0 /100 | #281 | Tragic 83.1% |
| Americans | 0.0 /100 | #282 | Tragic 83.1% |
| Immigrants | Azores | 0.0 /100 | #283 | Tragic 83.1% |
| Nicaraguans | 0.0 /100 | #284 | Tragic 83.1% |
| Belizeans | 0.0 /100 | #285 | Tragic 83.1% |
| Mexican American Indians | 0.0 /100 | #286 | Tragic 83.0% |
| Guyanese | 0.0 /100 | #287 | Tragic 83.0% |
Demographics Similar to Cape Verdeans by In Labor Force | Age 25-29
In terms of in labor force | age 25-29, the demographic groups most similar to Cape Verdeans are Bulgarian (86.0%, a difference of 0.010%), Immigrants from Ireland (86.0%, a difference of 0.010%), Maltese (86.0%, a difference of 0.020%), Bermudan (86.0%, a difference of 0.040%), and Cambodian (86.0%, a difference of 0.040%).
| Demographics | Rating | Rank | In Labor Force | Age 25-29 |
| Immigrants | Lithuania | 100.0 /100 | #12 | Exceptional 86.1% |
| Norwegians | 100.0 /100 | #13 | Exceptional 86.1% |
| Latvians | 100.0 /100 | #14 | Exceptional 86.1% |
| Bolivians | 100.0 /100 | #15 | Exceptional 86.1% |
| Immigrants | Bolivia | 100.0 /100 | #16 | Exceptional 86.1% |
| Bermudans | 100.0 /100 | #17 | Exceptional 86.0% |
| Bulgarians | 100.0 /100 | #18 | Exceptional 86.0% |
| Cape Verdeans | 100.0 /100 | #19 | Exceptional 86.0% |
| Immigrants | Ireland | 100.0 /100 | #20 | Exceptional 86.0% |
| Maltese | 100.0 /100 | #21 | Exceptional 86.0% |
| Cambodians | 100.0 /100 | #22 | Exceptional 86.0% |
| Immigrants | Uganda | 100.0 /100 | #23 | Exceptional 86.0% |
| Immigrants | Eastern Africa | 100.0 /100 | #24 | Exceptional 86.0% |
| Sudanese | 100.0 /100 | #25 | Exceptional 85.9% |
| Immigrants | North Macedonia | 100.0 /100 | #26 | Exceptional 85.9% |